. 2014 Jan;6(1):43-56.
doi: 10.1002/emmm.201302962.

Fas (CD95) expression in myeloid cells promotes obesity‐induced muscle insulin resistance

Fas (CD95) expression in myeloid cells promotes obesity‐induced muscle insulin resistance

Stephan Wueest et al. EMBO Mol Med. 2014 Jan.

Abstract

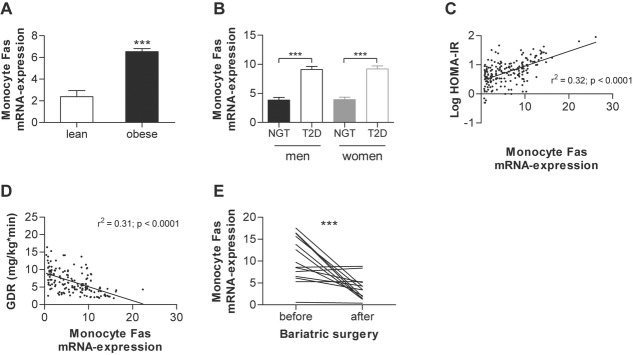
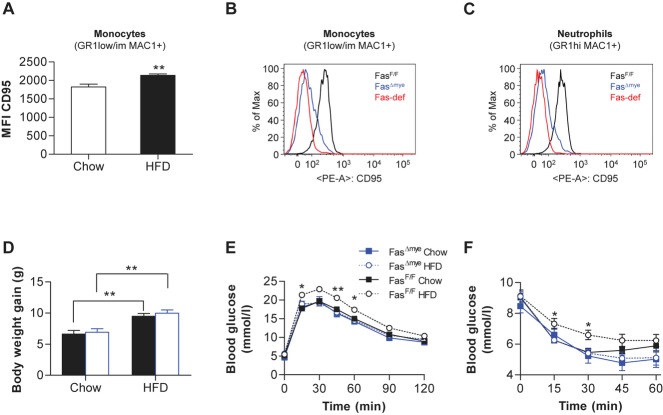
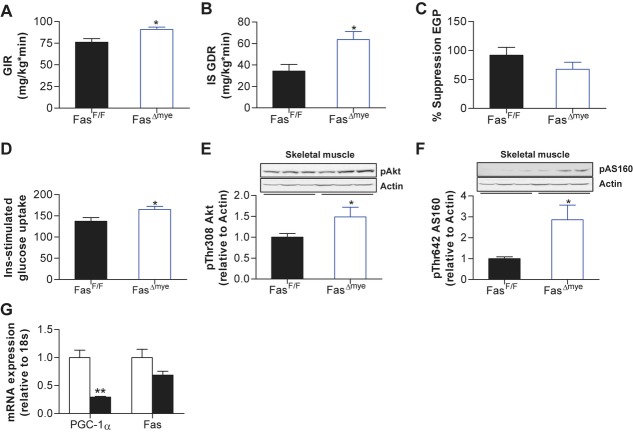
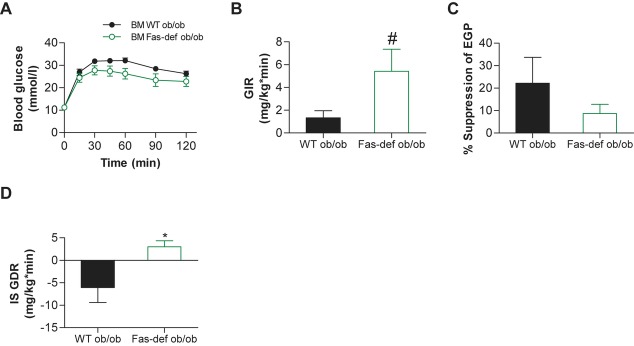
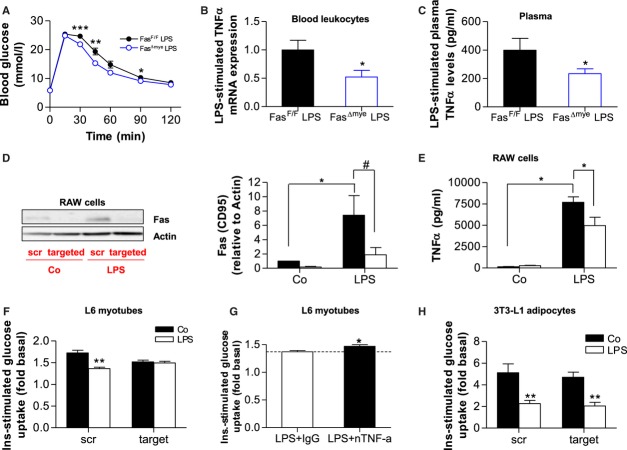
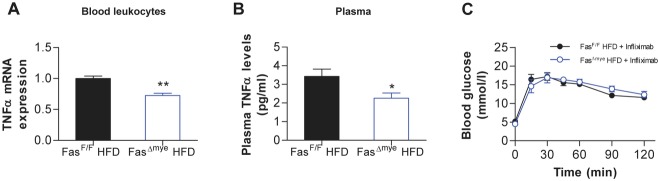
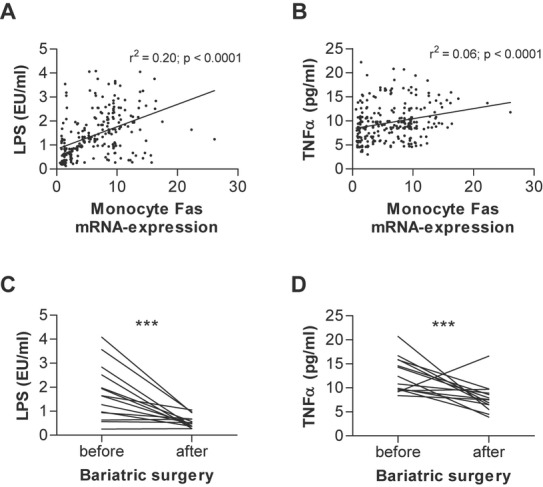
Low-grade inflammation in adipose tissue and liver has been implicated in obesity-associated insulin resistance and type 2 diabetes. Yet, the contribution of inflammatory cells to the pathogenesis of skeletal muscle insulin resistance remains elusive. In a large cohort of obese human individuals, blood monocyte Fas (CD95) expression correlated with systemic and skeletal muscle insulin resistance. To test a causal role for myeloid cell Fas expression in the development of skeletal muscle insulin resistance, we generated myeloid/haematopoietic cell-specific Fas-depleted mice. Myeloid/haematopoietic Fas deficiency prevented the development of glucose intolerance in high fat-fed mice, in ob/ob mice, and in mice acutely challenged by LPS. In vivo, ex vivo and in vitro studies demonstrated preservation of muscle insulin responsiveness with no effect on adipose tissue or liver. Studies using neutralizing antibodies demonstrated a role for TNFα as mediator between myeloid Fas and skeletal muscle insulin resistance, supported by significant correlations between monocyte Fas expression and circulating TNFα in humans. In conclusion, our results demonstrate an unanticipated crosstalk between myeloid cells and skeletal muscle in the development of obesity-associated insulin resistance.


Figures

Figure 1
Figure 1
Fas expression in circulating monocytes correlates negatively with insulin sensitivity in obese patients A  Monocytes were isolated from whole human blood samples of lean and obese subjects and Fas mRNA expression was measured normalized to HPRT. n = 16–247. **p = 0.005 (Student's t-test). Error bars represent SEM. B  Monocytes were isolated from whole human blood samples and Fas mRNA expression was measured normalized to HPRT. ***p < 0.0001 (Student's t-test). NGT: normal glucose tolerance (men n = 61; women n = 70); T2D: type 2 diabetes (men n = 57; women n = 58). Error bars represent SEM. C,D  Monocyte Fas mRNA expression was determined as described above and correlated to HOMA-IR (C) and glucose disposal rate (GDR) (D). n = 200 (C) and n = 163 (D). Error bars represent SEM. E  Monocyte Fas mRNA expression was determined in obese patients before and 6 months after bariatric surgery (gastric sleeve resection; n = 14), ***p = 0.0002 (Student's t-test).
Figure 2
Figure 2
FasΔmye mice are protected from HFD-induced glucose intolerance. A  Flow cytometric analysis of peripheral blood leukocytes of chow- and HFD-fed mice. Monocytes (GR1low/im MAC1+) were stained with respective antibodies. Bar graphs show mean fluorescence intensity (MFI) of Fas (CD95) of live monocytes. n = 6–8, **p = 0.005 (Student's t-test). Error bars represent SEM. B,C  Flow cytometric analysis of circulating monocytes (B) and neutrophils (C) of Fas-deficient, FasF/F and FasΔmye mice. Cells were stained with respective antibodies and Fas fluorescence was measured. D  Body weight change during 6 weeks of chow- or HFD-fed in FasF/F and FasΔmye mice. n = 7–20. **p = 0.002 (FasF/F chow vs. HFD); **p = 0.001 (FasΔmye chow vs. HFD; Student's t-test). Error bars represent SEM. E  Intra-peritoneal glucose-tolerance test in chow- and HFD-fed FasF/F and FasΔmye mice at 12 weeks of age. n = 6–10. *p = 0.049 and 0.035 after 15 and 60 min, respectively; **p = 0.008 (ANOVA). All error bars represent SEM. F  Intra-peritoneal insulin-tolerance test in chow- and HFD-fed FasF/F and FasΔmye mice at 12 weeks of age. n = 6–10. *p = 0.034 (15 min), *p = 0.012 (30 min; ANOVA). All error bars represent SEM.
Figure 3
Figure 3
FasΔmye mice are protected from HFD-induced muscle insulin resistance. A–C  Glucose infusion rate (GIR), insulin-stimulated glucose disposal rate (IS GDR) and% suppression of endogenous glucose production (EGP) during hyperinsulinaemic-euglycaemic clamps, n = 4–5, *p = 0.026 (A) and *p = 0.018 (B; Student's t-test). Error bars represent SEM. D  Insulin-stimulated glucose uptake into isolated soleus muscle of HFD-fed FasF/F and FasΔmye mice relative to basal uptake. n = 4–6, *p = 0.039 (Student's t-test). Error bars represent SEM. E,F  Representative Western blots of total muscle lysates of FasF/F and FasΔmye mice. Graphs show results of 6–10 (E) and 7–8 (F) mice. *p = 0.036 (E) and *p = 0.031 (F) (Student's t-test). Error bars represent SEM. G  mRNA expression of respective genes in skeletal muscle of chow (white bars) and HFD-fed (black bars) mice. n = 4. **p = 0.002 (Student'st-test). Error bars represent SEM.
Figure 4
Figure 4
ob/ob Bone marrow chimeras with Fas-depleted myeloid cells are protected from skeletal muscle insulin resistance. A–D  (A) Intra-peritoneal glucose-tolerance test and hyperinsulinaemic-euglycaemic clamp studies (B–D) with glucose infusion rate (GIR), insulin-inhibited endogenous glucose production (EGP) and insulin-stimulated glucose disposal rate (IS GDR) were performed in ob/ob BM WT and ob/ob BM Fas-def mice. n = 5–6, #p = 0.09 (Student's t-test), *p = 0.025 (Student's t-test). All error bars represent SEM.
Figure 5
Figure 5
Fas mediates myeloid-muscle cell communication leading to myocellular insulin resistance. A  Intra-peritoneal glucose-tolerance test in FasF/F and FasΔmye mice. LPS (1 mg/kg BW) was injected 45 min prior to glucose tolerance test. n = 7, *p = 0.022, **p = 0.005, ***p = 0.0007 (Student's t-test). Error bars represent SEM. B,C  Leukocyte-mRNA expression of TNFα (n = 6–7; B) and circulating plasma TNFα levels (n = 8–13; C) of FasF/F (black bars) and FasΔmye(blue bars) mice 60 min upon intraperitoneal injection of 1 mg/kg BW LPS. *p = 0.049 (Student's t-test). Error bars represent SEM. D  Representative Western blot and quantitative analysis of total lysates of RAW cells treated with scrambled (scr, black bars) or targeted (white bars) Fas siRNA for 48 h and subsequently stimulated with or without LPS (100 ng/ml for 6 h). n = 4–5, *p = 0.01 (Mann–Whitney test, scr Co vs. scr LPS) and #p = 0.07 Student's t-test, scr LPS vs. target LPS). Error bars represent SEM. E  RAW cells were treated with scrambled (scr, black bars) or target (white bars) Fas siRNA for 48 h. Thereafter, cells were stimulated with or without 100 ng/ml LPS for 6 h and cytokine release was measured. n = 6. *p = 0.047 (scr Co vs. scr LPS) and *p = 0.042 (scr LPS vs. target LPS; Student's t-test). Error bars represent SEM. F  L6 myotubes were incubated overnight with conditioned media from RAW cells treated as mentioned above and insulin-stimulated glucose uptake was measured. n = 4–7, **p = 0.002 (scr Co vs. scr LPS; Student's t-test). Error bars represent SEM. G  L6 myotubes were incubated overnight with conditioned media from LPS-stimulated RAW cells in the presence of IgG control (open bar) or nTNFα (black bar) antibody and insulin-stimulated glucose uptake was measured. Results are expressed relative to respective unstimulated values. n = 5, *p = 0.041. Error bars represent SEM. H  Mature 3T3-L1 adipocytes were incubated overnight with conditioned media from RAW cells treated as mentioned above and insulin-stimulated glucose uptake was measured. n = 4, **p = 0.016 (scr) and **p = 0.04 (target; Student's t-test). Error bars represent SEM.
Figure 6
Figure 6
Reduced circulating TNFα levels in FasΔmye mice. A,B  Leukocyte-mRNA expression of TNFα (n = 3–5; A) and circulating plasma TNFα levels (n = 12–15; B) of HFD-fed FasF/F (black bars) and FasΔmye (blue bars) mice. *p = 0.033, **p = 0.003 (Student's t-test). Error bars represent SEM. C  Intra-peritoneal glucose tolerance test in HFD-fed FasF/F and FasΔmyemice pre-treated with the TNFα neutralizing antibody infliximab. n = 4. All error bars represent SEM.
Figure 7
Figure 7
Human monocyte Fas expression positively correlates with serum LPS and TNFα levels. A,B  Monocyte Fas mRNA expression was determined and correlated to circulating LPS and TNFα levels. n = 246. C,D  Plasma LPS and TNFα levels were determined in obese patients before and 6 months after bariatric surgery (gastric sleeve resection; n = 14), ***p = 0.0007 (C) and ***p = 0.0009 (D) (Student's t-test).

References

    1. Anonymous. Diagnosis and classification of diabetes mellitus. Diabetes Care. 2011;34:S62–S69. - PMC - PubMed
    1. Araujo EP, Souza De CT, Ueno M, Cintra DE, Bertolo MB, Carvalheira JB, Saad MJ, Velloso LA. Infliximab restores glucose homeostasis in an animal model of diet-induced obesity and diabetes. Endocrinology. 2007;148:5991–5997. - PubMed
    1. Arkan MC, Hevener AL, Greten FR, Maeda S, Li ZW, Long JM, Wynshaw-Boris A, Poli G, Olefsky J, Karin M. IKK-beta links inflammation to obesity-induced insulin resistance. Nat Med. 2005;11:191–198. - PubMed
    1. Cani PD, Amar J, Iglesias MA, Poggi M, Knauf C, Bastelica D, Neyrinck AM, Fava F, Tuohy KM, Chabo C, et al. Metabolic endotoxemia initiates obesity and insulin resistance. Diabetes. 2007;56:1761–1772. - PubMed
    1. Clausen BE, Burkhardt C, Reith W, Renkawitz R, Forster I. Conditional gene targeting in macrophages and granulocytes using LysMcre mice. Transgenic Res. 1999;8:265–277. - PubMed

Publication types

MeSH terms