

Visualizing the ai5γ group IIB intron
- PMID: 24203709
- PMCID: PMC3919574
- DOI: 10.1093/nar/gkt1051
Visualizing the ai5γ group IIB intron
Abstract
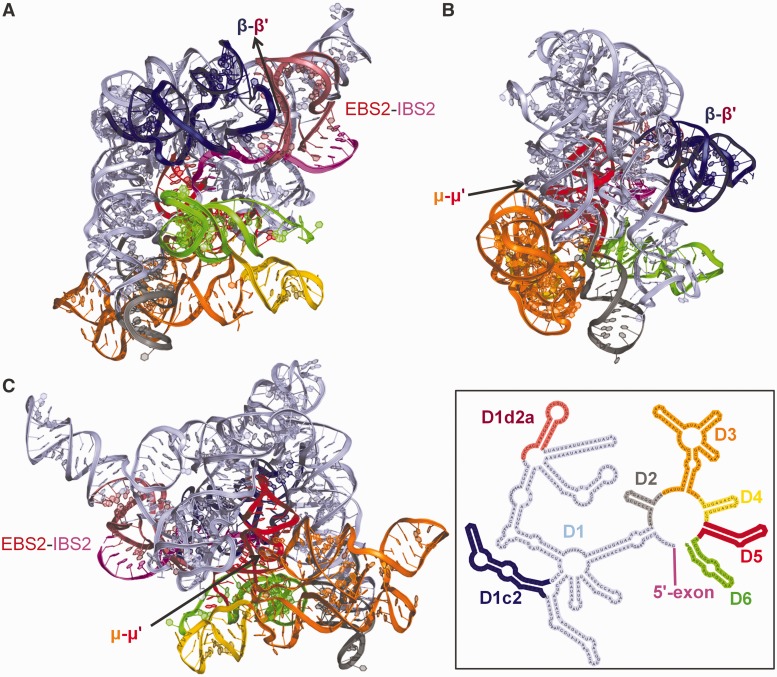
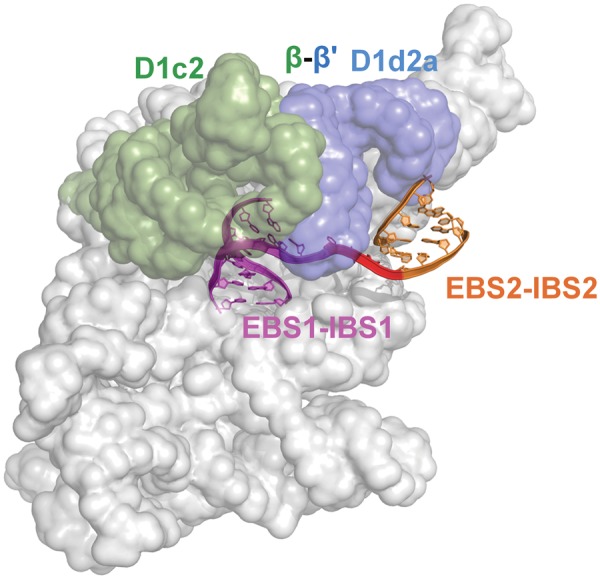
It has become apparent that much of cellular metabolism is controlled by large well-folded noncoding RNA molecules. In addition to crystallographic approaches, computational methods are needed for visualizing the 3D structure of large RNAs. Here, we modeled the molecular structure of the ai5γ group IIB intron from yeast using the crystal structure of a bacterial group IIC homolog. This was accomplished by adapting strategies for homology and de novo modeling, and creating a new computational tool for RNA refinement. The resulting model was validated experimentally using a combination of structure-guided mutagenesis and RNA structure probing. The model provides major insights into the mechanism and regulation of splicing, such as the position of the branch-site before and after the second step of splicing, and the location of subdomains that control target specificity, underscoring the feasibility of modeling large functional RNA molecules.
Figures


Similar articles
-
Visualizing the solvent-inaccessible core of a group II intron ribozyme.EMBO J. 2001 Apr 17;20(8):2051-61. doi: 10.1093/emboj/20.8.2051. EMBO J. 2001. PMID: 11296237 Free PMC article.
-
Productive folding to the native state by a group II intron ribozyme.J Mol Biol. 2002 Jan 18;315(3):297-310. doi: 10.1006/jmbi.2001.5233. J Mol Biol. 2002. PMID: 11786013
-
The tertiary structure of group II introns: implications for biological function and evolution.Crit Rev Biochem Mol Biol. 2010 Jun;45(3):215-32. doi: 10.3109/10409231003796523. Crit Rev Biochem Mol Biol. 2010. PMID: 20446804 Free PMC article. Review.
-
Predicting RNA structure by multiple template homology modeling.Pac Symp Biocomput. 2010:216-27. doi: 10.1142/9789814295291_0024. Pac Symp Biocomput. 2010. PMID: 19908374 Free PMC article.
-
Group II introns: highly specific endonucleases with modular structures and diverse catalytic functions.Methods. 2002 Nov;28(3):323-35. doi: 10.1016/s1046-2023(02)00239-6. Methods. 2002. PMID: 12431436 Review.
Cited by
-
Progress and Current Challenges in Modeling Large RNAs.J Mol Biol. 2016 Feb 27;428(5 Pt A):736-747. doi: 10.1016/j.jmb.2015.11.011. Epub 2015 Nov 14. J Mol Biol. 2016. PMID: 26585404 Free PMC article. Review.
-
Metal ions and sugar puckering balance single-molecule kinetic heterogeneity in RNA and DNA tertiary contacts.Nat Commun. 2020 Jan 8;11(1):104. doi: 10.1038/s41467-019-13683-4. Nat Commun. 2020. PMID: 31913262 Free PMC article.
-
Retroviral-like determinants and functions required for dimerization of Ty1 retrotransposon RNA.RNA Biol. 2019 Dec;16(12):1749-1763. doi: 10.1080/15476286.2019.1657370. Epub 2019 Aug 30. RNA Biol. 2019. PMID: 31469343 Free PMC article.
-
Structural Insights into the Mechanism of Group II Intron Splicing.Trends Biochem Sci. 2017 Jun;42(6):470-482. doi: 10.1016/j.tibs.2017.03.007. Epub 2017 Apr 21. Trends Biochem Sci. 2017. PMID: 28438387 Free PMC article. Review.
-
Mobile Bacterial Group II Introns at the Crux of Eukaryotic Evolution.Microbiol Spectr. 2015 Feb;3(1):MDNA3-0050-2014. doi: 10.1128/microbiolspec.MDNA3-0050-2014. Microbiol Spectr. 2015. PMID: 26104554 Free PMC article. Review.
References
-
- Ferat JL, Michel F. Group II self-splicing introns in bacteria. Nature. 1993;364:358–361. - PubMed
-
- Guo H, Karberg M, Long M, Jones JP, 3rd, Sullenger B, Lambowitz AM. Group II introns designed to insert into therapeutically relevant DNA target sites in human cells. Science. 2000;289:452–457. - PubMed
Publication types
MeSH terms
Substances
Grants and funding
LinkOut - more resources
Full Text Sources
Other Literature Sources
Molecular Biology Databases
