

Diabetes care quality is highly correlated with patient panel characteristics
- PMID: 24204063
- PMCID: PMC3922763
- DOI: 10.3122/jabfm.2013.06.130018
Diabetes care quality is highly correlated with patient panel characteristics
Abstract
Introduction: Health care reimbursement is increasingly based on quality. Little is known about how clinic-level patient characteristics affect quality, particularly in community health centers (CHCs).
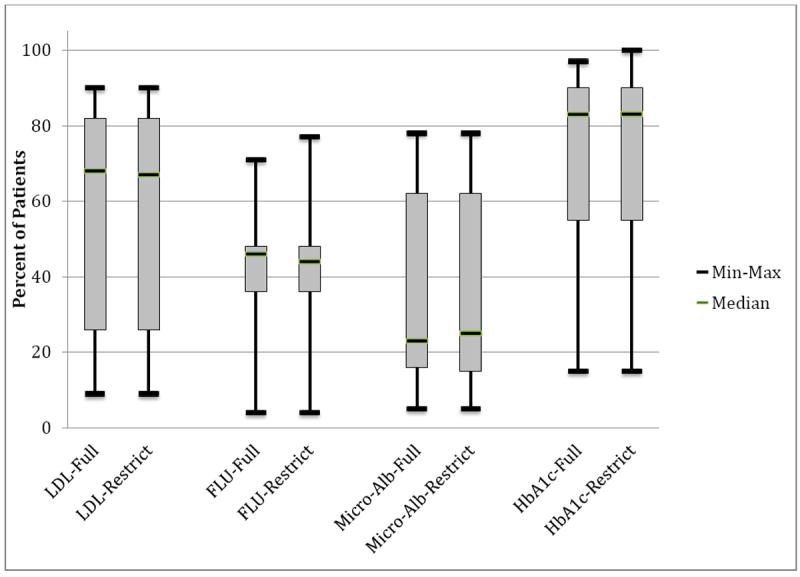
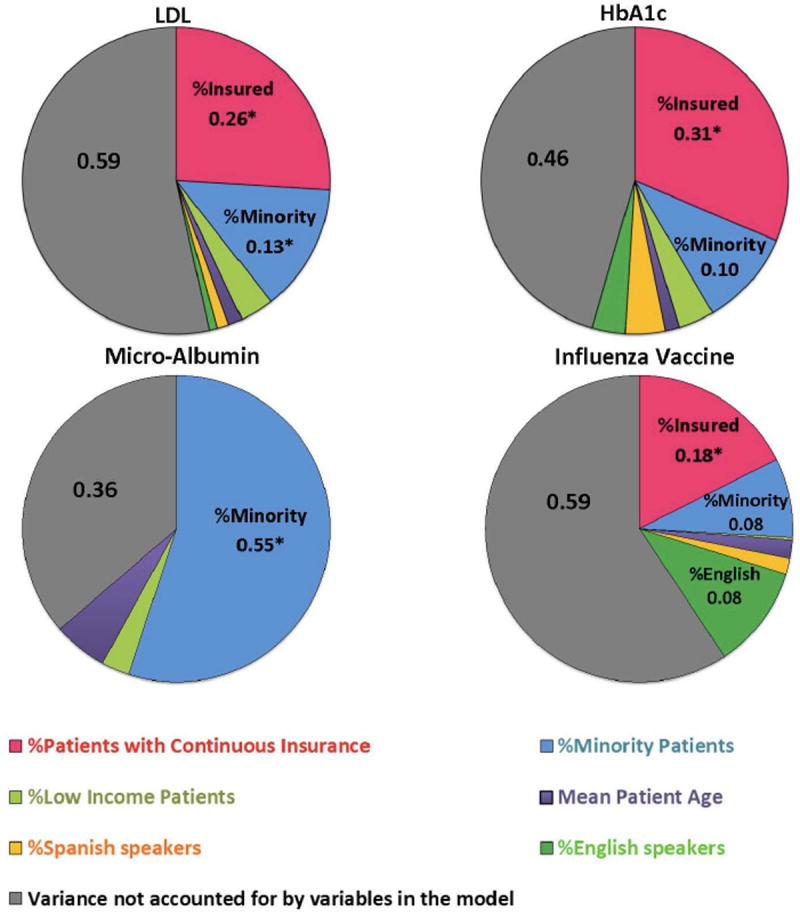
Methods: Using data from electronic health records for 4019 diabetic patients from 23 primary care CHCs in the OCHIN practice-based research network, we calculated correlations between a clinic's patient panel characteristics and rates of delivery of diabetes preventive services in 2007. Using regression models, we estimated the proportion of variability in clinics' preventive services rates associated with the variability in the clinics' patient panel characteristics. We also explored whether clinics' performance rates were affected by how patient panel denominators were defined.
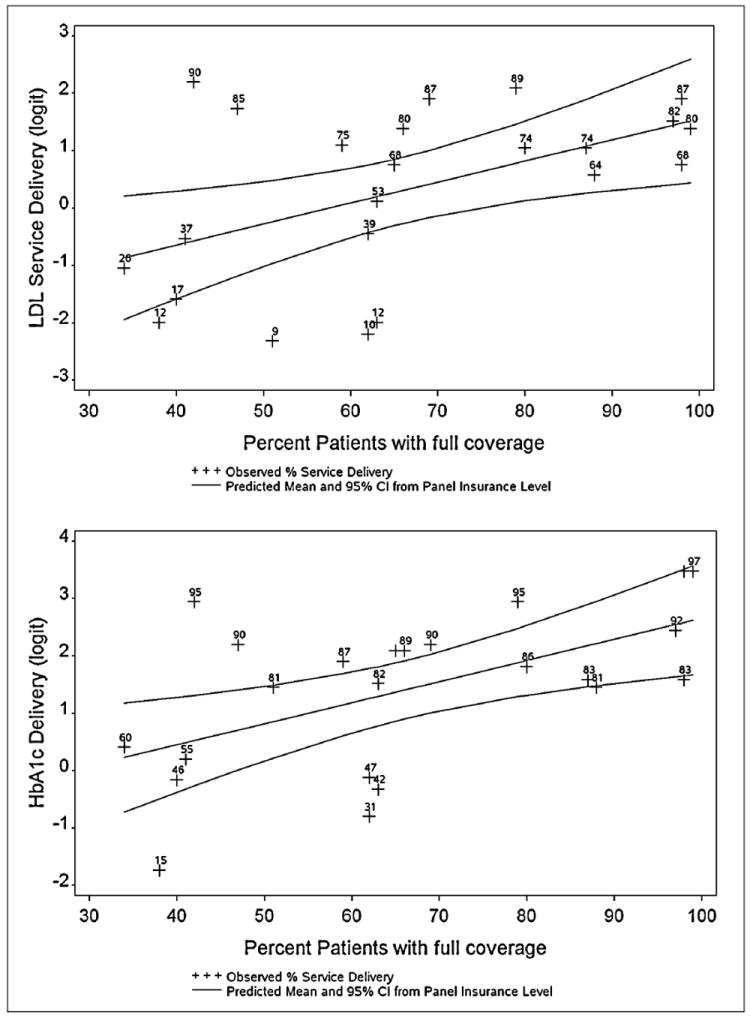
Results: Clinic rates of hemoglobin testing, influenza immunizations, and lipid screening were positively associated with the percentage of patients with continuous health insurance coverage and negatively associated with the percentage of uninsured patients. Microalbumin screening rates were positively associated with the percentage of racial minorities in a clinic's panel. Associations remained consistent with different panel denominators.
Conclusions: Clinic variability in delivery rates of preventive services correlates with differences in clinics' patient panel characteristics, particularly the percentage of patients with continuous insurance coverage. Quality scores that do not account for these differences could create disincentives to clinics providing diabetes care for vulnerable patients.
Keywords: Diabetes Mellitus; Health Care Systems; Health Insurance; Health Policy.
Conflict of interest statement
Conflict of Interest: None.
Figures
References
-
- VanLare JM, Conway PH. Value-based purchasing--national programs to move from volume to value. N Engl J Med. 2012 Jul 26;367(4):292–295. - PubMed
-
- Chassin MR, Galvin RW. The urgent need to improve health care quality. Institute of Medicine National Roundtable on Health Care Quality. JAMA. 1998 Sep 16;280(11):1000–1005. - PubMed
-
- McGlynn EA, Asch SM, Adams J, et al. The Quality of Health Care Delivered to Adults in the United States. N Engl J Med. 2003;348(26):2635–2645. - PubMed
-
- Porter ME. What is value in health care? N Engl J Med. 2010 Dec 23;363(26):2477–2481. - PubMed
-
- Galvin RS, McGlynn EA. Using performance measurement to drive improvement: a road map for change. Medical care. 2003 Jan;41(1 Suppl):I48–60. - PubMed
Publication types
MeSH terms
Grants and funding
LinkOut - more resources
Full Text Sources
Other Literature Sources
Medical