. 2013 Oct;15(10):1151-60.
doi: 10.1593/neo.131304.

Dependence of tumor cell lines and patient-derived tumors on the NAD salvage pathway renders them sensitive to NAMPT inhibition with GNE-618

Affiliations

Dependence of tumor cell lines and patient-derived tumors on the NAD salvage pathway renders them sensitive to NAMPT inhibition with GNE-618

Yang Xiao et al. Neoplasia. 2013 Oct.

Abstract

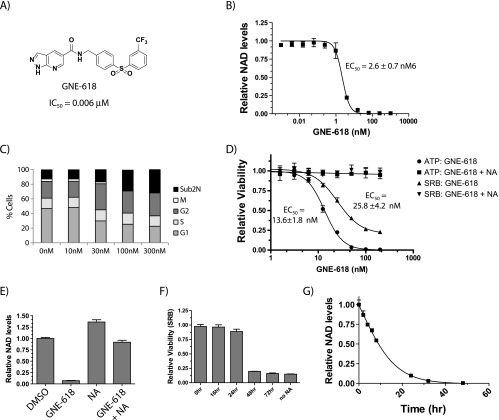
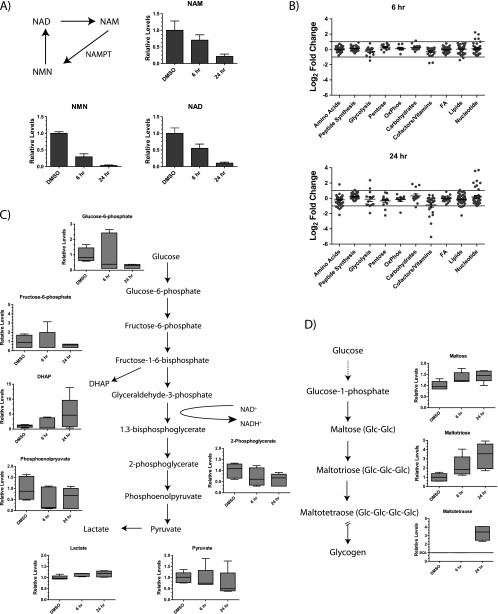
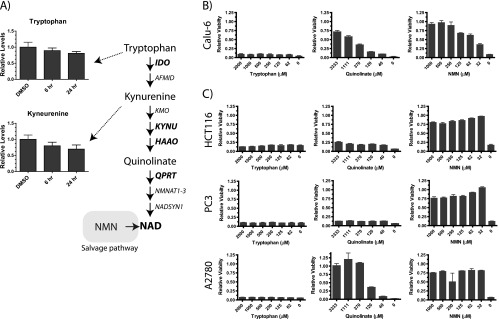
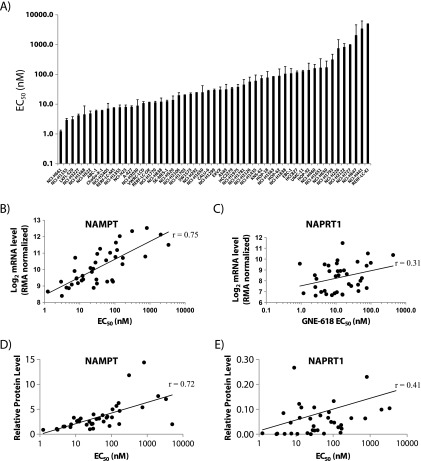
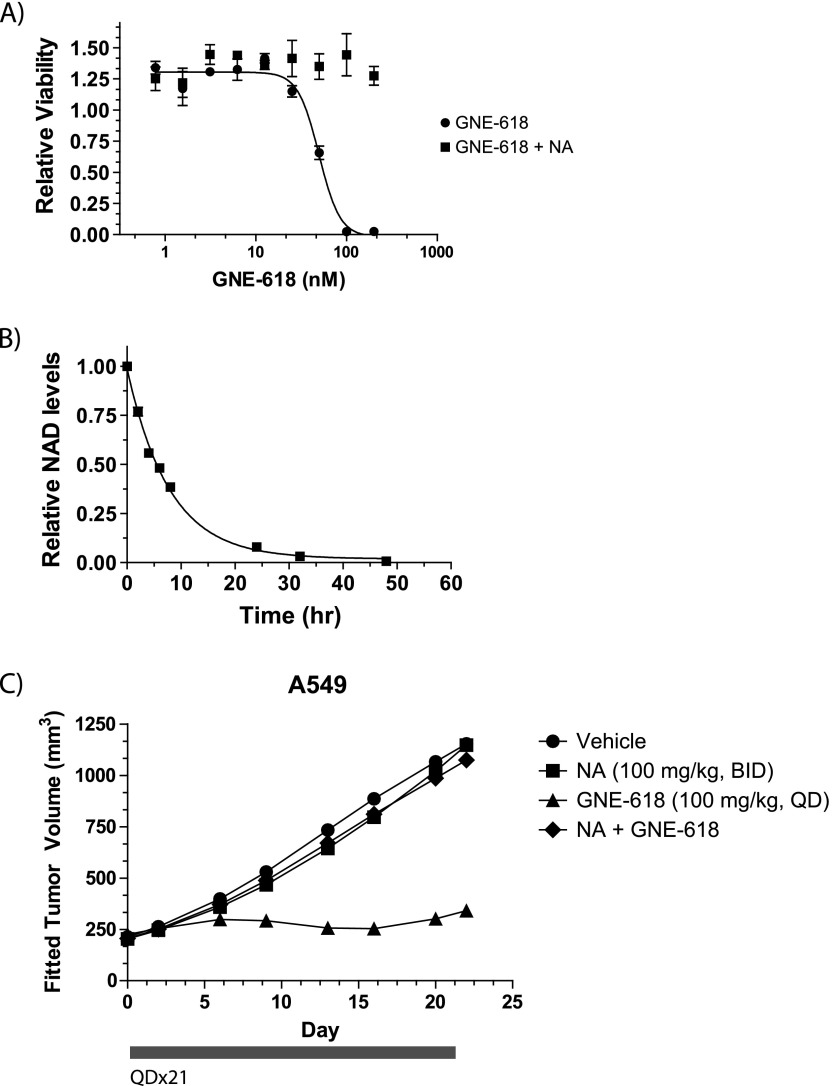
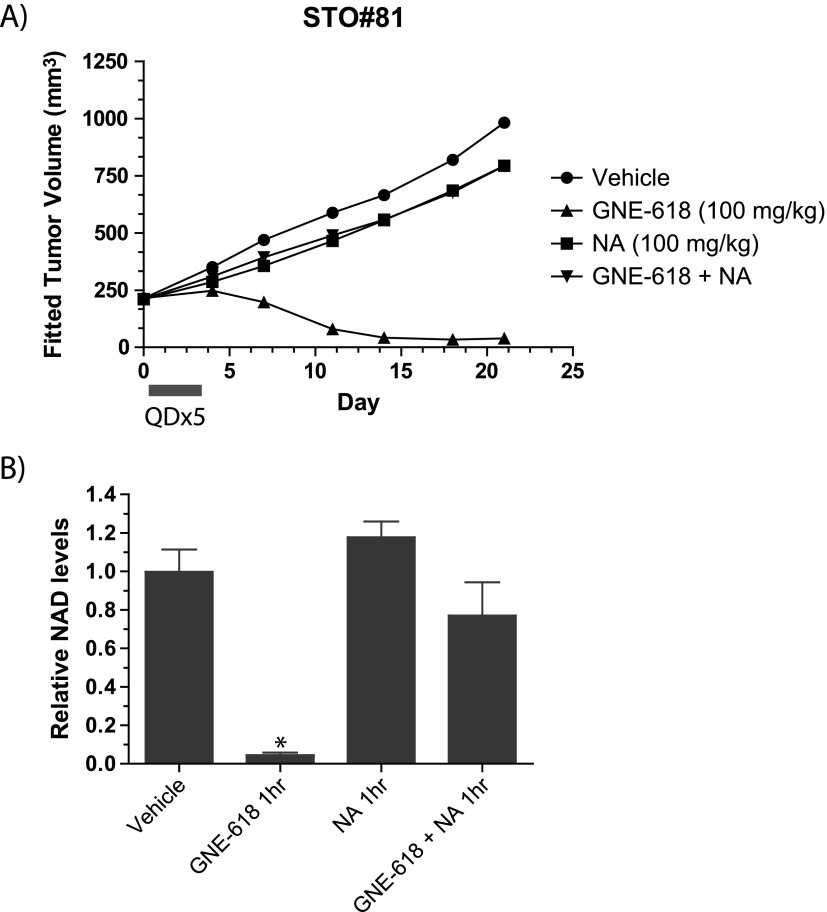
Nicotinamide adenine dinucleotide (NAD) is a critical metabolite that is required for a range of cellular reactions. A key enzyme in the NAD salvage pathway is nicotinamide phosphoribosyl transferase (NAMPT), and here, we describe GNE-618, an NAMPT inhibitor that depletes NAD and induces cell death in vitro and in vivo. While cells proficient for nicotinic acid phosphoribosyl transferase (NAPRT1) can be protected from NAMPT inhibition as they convert nicotinic acid (NA) to NAD independent of the salvage pathway, this protection only occurs if NA is added before NAD depletion. We also demonstrate that tumor cells are unable to generate NAD by de novo synthesis as they lack expression of key enzymes in this pathway, thus providing a mechanistic rationale for the reliance of tumor cells on the NAD salvage pathway. Identifying tumors that are sensitive to NAMPT inhibition is one potential way to enhance the therapeutic effectiveness of an NAMPT inhibitor, and here, we show that NAMPT, but not NAPRT1, mRNA and protein levels inversely correlate with sensitivity to GNE-618 across a panel of 53 non-small cell lung carcinoma cell lines. Finally, we demonstrate that GNE-618 reduced tumor growth in a patient-derived model, which is thought to more closely represent heterogeneous primary patient tumors. Thus, we show that dependence of tumor cells on the NAD salvage pathway renders them sensitive to GNE-618 in vitro and in vivo, and our data support further evaluation of the use of NAMPT mRNA and protein levels as predictors of overall sensitivity.


Figures

Figure 1
Figure 1
GNE-618 reduces NAD levels and cell viability in Calu-6 NSCLC cells. (A) Structure of GNE-618 and its associated IC50 for NAMPT. (B) A dose titration of GNE-618 reduces NAD levels in Calu-6 cells at 48 hours as measured by LC-MS/MS (average ± SD, n = 2 (C) Cell cycle analysis of Calu-6 cells following 72-hour incubation with the indicated concentrations of GNE-618 (averages ± SD, n = 2). (D) GNE-618 reduces ATP and protein levels (SRB assay) (average ± SD, n = 3). In both cases, co-administration of 10 µM NA with GNE-618 prevents loss of viability. (E) Calu-6 cells were incubated with 200 nM GNE-618, 10 µM NA, or both for 48 hours, and NAD levels were quantified by LC-MS/MS (average ± SD is shown, n = 2). (F) GNE-618 was added to Calu-6 cells at time 0, and 10 µM NA was added at the indicated times and viability was assessed at 96 hours (SRB assay; average ± SD, n = 2). (G) Calu-6 cells were exposed to 100 nM GNE-618 for various times and harvested, and NAD levels were determined by LC-MS/MS (average ± SD, n = 2).
Figure 2
Figure 2
Metabolomic profiling of Calu-6 tumor cells following NAMPT inhibition. (A) Calu-6 cells were exposed to 100 nM GNE-618 for 6 or 24 hours, and metabolomic profiling was used to evaluate changes in a total of 367 unique metabolites. The levels of NAD, NMN, and NAM at 6 and 24 hours following exposure to GNE-618 are shown relative to levels in control cells (average ± SD, n = 5 for each group). (B) The graphs indicate the log2-fold change in each metabolite relative to control cells at 6 and 24 hours following exposure to GNE-618 (n = 5 for each time point). Modulation of metabolites involved in glycolysis (C) or glycogen storage (D) in Calu-6 cells at 6 and 24 hours is shown. The relative level of each detectable metabolite is shown (n = 5). The whiskers span the 10% to 90% percentile range of the data, and the median is shown as a line.
Figure 3
Figure 3
Tumor cell lines are unable to use the de novo pathway to generate NAD. (A) Two metabolites (tryptophan and kynurenine) in the de novo pathway were detected in our metabolomic profiling, and their relative levels in control cells or cells exposed to GNE-618 for 6 and 24 hours are shown (n = 5 ± SD). Key metabolites in the de novo salvage pathway are shown in the pathway diagram along with the enzymes that catalyze each step. (B) Calu-6 cells were incubated with 200 nM GNE-618 and a dose titration of tryptophan, quinolinate, or NMN, for 96 hours, and cell viability was assessed (CyQUANT readout; average ± SD, n = 2). (C) HCT-116, PC-3, and A2780 cells were incubated with 200 nM GNE-618 and a dose titration of tryptophan, quinolinate, or NMN, for 96 hours, and cell viability was assessed (CyQUANT readout; average ± SD, n = 3).
Figure 4
Figure 4
NAMPT, but not NAPRT1, mRNA and protein levels correlate with sensitivity to GNE-618. (A) The calculated EC50 (average ± SD, n = 3) for each cell line following exposure to GNE-618 for a total of 96 hours (CellTiter-Glo) is shown. NAMPT (B) or NAPRT1 (C) mRNA levels (log2, RMA normalized) [22] were compared to the EC50 for GNE-618 for each cell line. Representative cell lines were assayed for NAMPT (D) or NAPRT1 (E) protein levels by Western blot analysis. Protein levels in each line were compared to the corresponding EC50 for GNE-618.
Figure 5
Figure 5
GNE-618 inhibits tumor growth of an A549 NSCLC xenograft model. (A) A549 cells were incubated with a dose titration of GNE-618 in the presence or absence of 10 µM NA, and viability was measured after 96 hours (CellTiter-Glo assay; average ± SD, n = 3). (B) A549 cells were exposed to 100 nM GNE-618 for various times, and NAD levels were determined by LC-MS/MS (average ± SD, n = 2). (C) GNE-618 was administered orally and daily for 21 days, and NA was co-administered orally twice daily for 21 days in A549 tumor xenografts (n = 10 animals per group). The bar below the x-axis indicates the dosing period.
Figure 6
Figure 6
GNE-618 inhibits growth of the STO#81 patient-derived gastric model. (A) GNE-618 was administered orally for 5 days at 100 mg/kg, and tumor growth was monitored for 24 days (n = 10 animals per group). NA (100 mg/kg) was either dosed alone or with GNE-618 orally twice daily for 5 days. The bar below the x-axis indicates the dosing period. (B) NAD levels in tumors derived from the STO#81 model harvested at 1 hour following the final oral dose of GNE-618 (100 mg/kg) ± NA (100 mg/kg) on day 5. Tumors were harvested and NAD levels were quantified by LC-MS/MS. The average tumor NAD level ± SD (n = 4 animals per group) relative to vehicle-treated animals is shown. Asterisk indicates P < .005.

References

    1. Ward PS, Thompson CB. Metabolic reprogramming: a cancer hallmark even Warburg did not anticipate. Cancer Cell. 2012;21(3):297–308. - PMC - PubMed
    1. Yan H, Parsons DW, Jin G, McLendon R, Rasheed BA, Yuan W, Kos I, Batinic-Haberle I, Jones S, Riggins GJ, et al. IDH1 and IDH2 mutations in gliomas. N Engl J Med. 2009;360(8):765–773. - PMC - PubMed
    1. Tomlinson IP, Alam NA, Rowan AJ, Barclay E, Jaeger EE, Kelsell D, Leigh I, Gorman P, Lamlum H, Rahman S, et al. Germline mutations in FH predispose to dominantly inherited uterine fibroids, skin leiomyomata and papillary renal cell cancer. Nat Genet. 2002;30(4):406–410. - PubMed
    1. Locasale JW, Grassian AR, Melman T, Lyssiotis CA, Mattaini KR, Bass AJ, Heffron G, Metallo CM, Muranen T, Sharfi H, et al. Phosphoglycerate dehydrogenase diverts glycolytic flux and contributes to oncogenesis. Nat Genet. 2011;43(9):869–874. - PMC - PubMed
    1. Ying H, Kimmelman AC, Lyssiotis CA, Hua S, Chu GC, Fletcher-Sananikone E, Locasale JW, Son J, Zhang H, Coloff JL, et al. Oncogenic Kras maintains pancreatic tumors through regulation of anabolic glucose metabolism. Cell. 2012;149(3):656–670. - PMC - PubMed

MeSH terms

LinkOut - more resources