. 2013 Oct;9(10):e1003302.
doi: 10.1371/journal.pcbi.1003302. Epub 2013 Oct 24.

A comprehensive survey of small-molecule binding pockets in proteins

Affiliations

A comprehensive survey of small-molecule binding pockets in proteins

Mu Gao et al. PLoS Comput Biol. 2013 Oct.

Abstract

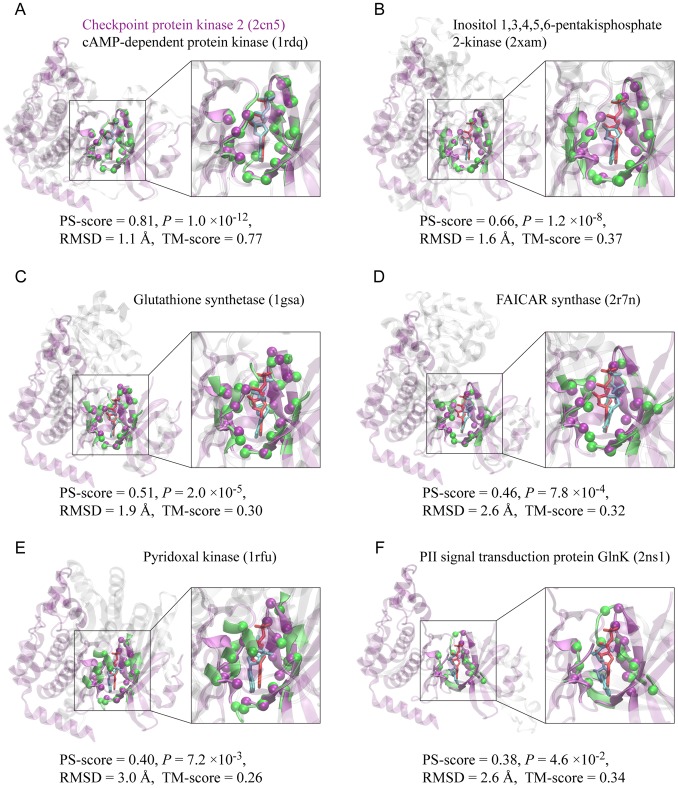
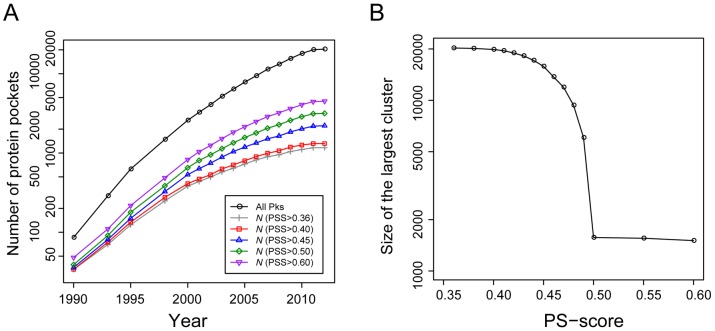
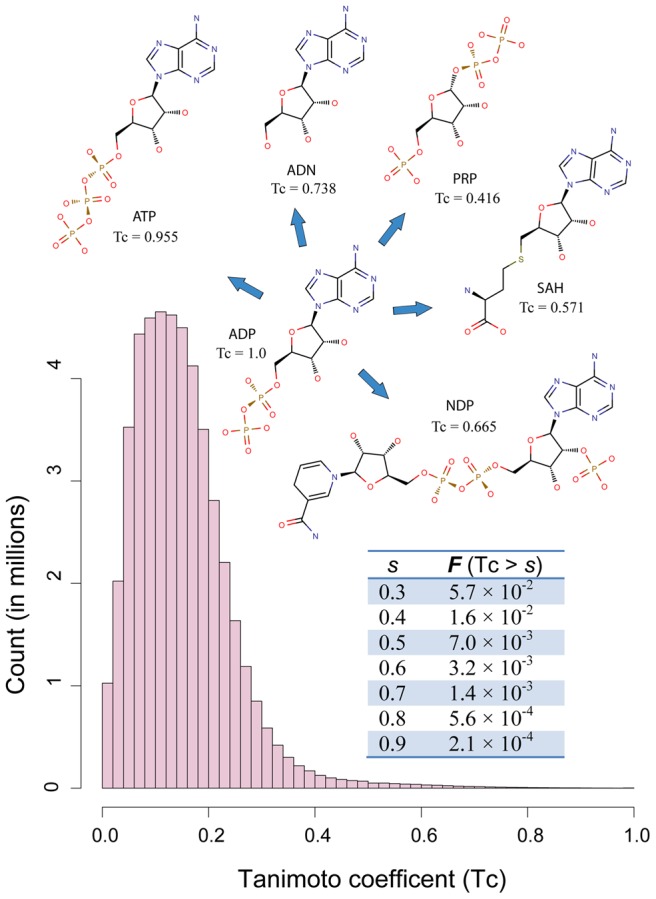
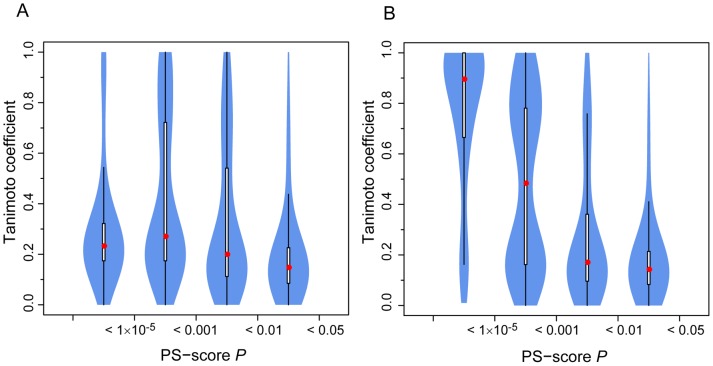
Many biological activities originate from interactions between small-molecule ligands and their protein targets. A detailed structural and physico-chemical characterization of these interactions could significantly deepen our understanding of protein function and facilitate drug design. Here, we present a large-scale study on a non-redundant set of about 20,000 known ligand-binding sites, or pockets, of proteins. We find that the structural space of protein pockets is crowded, likely complete, and may be represented by about 1,000 pocket shapes. Correspondingly, the growth rate of novel pockets deposited in the Protein Data Bank has been decreasing steadily over the recent years. Moreover, many protein pockets are promiscuous and interact with ligands of diverse scaffolds. Conversely, many ligands are promiscuous and interact with structurally different pockets. Through a physico-chemical and structural analysis, we provide insights into understanding both pocket promiscuity and ligand promiscuity. Finally, we discuss the implications of our study for the prediction of protein-ligand interactions based on pocket comparison.


Conflict of interest statement

The authors have declared that no competing interests exist.

Figures

Figure 1
Figure 1. Examples of pocket alignments according to APoc.
(A–F) Six ADP-binding pockets taken from six different protein structures (green) are aligned to a common ADP-binding pocket from the checkpoint protein kinase Chk2 (purple). In each snapshot, the two protein structures are shown in cartoon representations, and the corresponding bound-ligands are shown in cyan and red licorice representations, respectively. For clarity, non-pocket regions are shown in transparent purple in Chk2, and in transparent grey in the other proteins, whereas pocket regions are shown in solid purple in Chk2 and solid green in the other cases. Aligned pocket Cα atoms are shown as spheres. An enlarged view of the pocket alignment is displayed on the right. The top label denotes the name of the protein and its PDB accession code in parentheses; and the bottom label denotes the corresponding PS-score, P-value, RMSD of aligned atoms, and the TM-score. Molecular images were created with VMD . They were taken in the same view at Chk2.
Figure 2
Figure 2. Representative protein pockets for ligand-binding in the PDB.
(A) Number of representative pockets versus year. “All Pks” denotes all 20,414 non-redundant pockets collected from the PDB up to May, 2012. The number of representative pockets was obtained by finding the smallest dominating set of all pockets at a specified PS-score (PSS) and a significant P<0.01. The number of pockets is shown on a logarithmic scale. (B) Size of the largest cluster of pockets at different PS-scores. Each PS-score threshold defines a graph representing the structural relationships of pockets. In each graph, the largest cluster forming the LSCC is then identified, and the size of the LSCC is plotted against the PS-score threshold.
Figure 3
Figure 3. Distribution of Tanimoto coefficient scores of small-molecule compounds found in the PDB.
Tc scores from all-against-all comparison of 9,485 ligands were employed to create the histogram. Insert table shows the fraction of Tc scores higher than threshold scores. Insert diagrams display chemical structures of ADP and five structurally related ligands: adenosine triphosphate (ATP), adenosine (ADN), NADPH dihydro-nicotinamide-adenine-dinucleotide phosphate (NDP), S-adenosyl-L-homocysteine (SAH), and α-phosphoribosylpyrophosphoric acid (PRP). Their Tc scores in comparison to ADP are provided under their name labels.
Figure 4
Figure 4. Violin plot of chemical similarity of ligands found in structurally similar pockets.
(A) All 7 million pairs of pockets at PS-score P-values<0.05 are considered. The x-axis labels mark similarity regimes for pocket pairs considered. (B) The subset of pocket pairs from proteins with low pairwise global structural similarity at the TM-score <0.4. A Violin plot is derived from a boxplot by scaling the width of the box such that the area is proportional to the number of pairs of ligands observed. The white bars range from 25th to 75th percentile, and the whiskers extend to a distance of up to 1.5 times the interquartile range. The red spheres represent the medians.
Figure 5
Figure 5. Cumulative fraction of 20,414 pockets matched by templates at a similarity level better than the given PS-score P-value.
Curves are generated separately at different levels of ligand similarity as measured by Tc. The vertical dotted line is located at a P-value = 0.05 for the PS-score.
Figure 6
Figure 6. Four examples of promiscuous pockets recognized by ligands of different chemical structures.
(A–D) Each panel is composed of three snapshots. On the left is the APoc superimposition of the same protein pockets separately in complex with two ligands. The representation is the same as in Fig. 1. Labels of ligands and PDB codes (in parentheses) are in the same color scheme as their 3D images. On the middle and right are the schematic 2D views of the two ligands and their respective interacting pocket residues. Ligands are shown in a stick and ball representation. Protein residues that form hydrogen bonds are also shown in a stick and ball representation, and other contacting residues are shown in a green eyelash representation. In the stick and ball representation, carbon, oxygen, nitrogen, phosphorus, sulfur, chlorine, fluorine atoms are shown as cyan, red, blue, brown, yellow, green, purple balls, and covalent bonds in the ligand and protein are shown in cyan and orange sticks. Hydrogen bonds are indicated by green dashed lines, with their lengths (all less than 3.35 Å) not drawn to scale. Amino acids are labeled by their one-letter code followed by their residue index in the original PDB records, except for 4cox in (B), whose residue indexes are renamed to be consistent to 3ln1 for clarity. Diagrams of ligand-protein interactions were created with the program LigPlot+ .
Figure 7
Figure 7. Distribution of conserved contacts between dissimilar ligands (Tc<0.3) bound to the same pockets.
(A) Overall distribution of all conserved contacts that are not unfavorable. The inserted pie chart shows ligand-protein interactions by type according their contributions to the overall contact surface area. (B) Distributions of individual types of ligand-protein interactions that are conserved between two pairs of ligand/pocket interactions.
Figure 8
Figure 8. Statistics of protein pockets recognizing similar or identical ligands.
(A) Cumulative fraction of pocket pairs at a pocket similarity better than then given PS-score P-value. Each pair of pockets bind to similar or identical ligands in various Tc regimes. The dotted line is located at P = 0.05. (B) Cumulative fraction of ligands versus the coverage of their largest pocket cluster defined by the LSCC. The coverage is the size of the LSCC divided by the number of all pockets within each ligand's pocket space. (C) Cumulative faction of identical ligand pairs with an atomic RMSD less than a given value. Ligand pairs are categorized into two groups according to the similarity of their corresponding pockets. A PS-score P of 0.05 was employed as the threshold for the categorization.

Similar articles

Cited by

References

    1. Kanehisa M, Goto S (2000) KEGG: kyoto encyclopedia of genes and genomes. Nucleic Acids Research 28: 27–30. - PMC - PubMed
    1. Ashburner M, Ball CA, Blake JA, Botstein D, Butler H, et al. (2000) Gene Ontology: tool for the unification of biology. Nature Genetics 25: 25–29. - PMC - PubMed
    1. Laskowski RA, Luscombe NM, Swindells MB, Thornton JM (1996) Protein clefts in molecular recognition and function. Protein Science 5: 2438–2452. - PMC - PubMed
    1. Liang J, Edelsbrunner H, Woodward C (1998) Anatomy of protein pockets and cavities: Measurement of binding site geometry and implications for ligand design. Protein Science 7: 1884–1897. - PMC - PubMed
    1. Gao M, Skolnick J (2010) Structural space of protein-protein interfaces is degenerate, close to complete, and highly connected. Proceedings of the National Academy of Sciences of the United States of America 107: 22517–22522. - PMC - PubMed

Publication types