

Robust demographic inference from genomic and SNP data
- PMID: 24204310
- PMCID: PMC3812088
- DOI: 10.1371/journal.pgen.1003905
Robust demographic inference from genomic and SNP data
Abstract
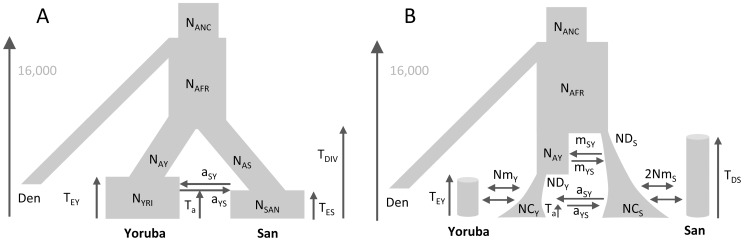
We introduce a flexible and robust simulation-based framework to infer demographic parameters from the site frequency spectrum (SFS) computed on large genomic datasets. We show that our composite-likelihood approach allows one to study evolutionary models of arbitrary complexity, which cannot be tackled by other current likelihood-based methods. For simple scenarios, our approach compares favorably in terms of accuracy and speed with ∂a∂i, the current reference in the field, while showing better convergence properties for complex models. We first apply our methodology to non-coding genomic SNP data from four human populations. To infer their demographic history, we compare neutral evolutionary models of increasing complexity, including unsampled populations. We further show the versatility of our framework by extending it to the inference of demographic parameters from SNP chips with known ascertainment, such as that recently released by Affymetrix to study human origins. Whereas previous ways of handling ascertained SNPs were either restricted to a single population or only allowed the inference of divergence time between a pair of populations, our framework can correctly infer parameters of more complex models including the divergence of several populations, bottlenecks and migration. We apply this approach to the reconstruction of African demography using two distinct ascertained human SNP panels studied under two evolutionary models. The two SNP panels lead to globally very similar estimates and confidence intervals, and suggest an ancient divergence (>110 Ky) between Yoruba and San populations. Our methodology appears well suited to the study of complex scenarios from large genomic data sets.
Conflict of interest statement
The authors have declared that no competing interests exist.
Figures
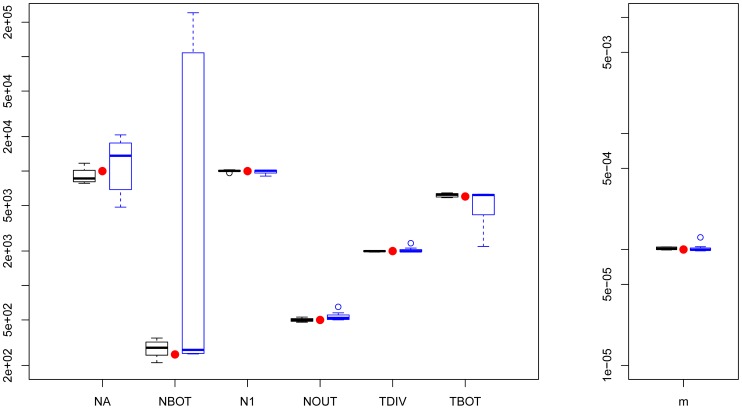
 's results (8/10) are in blue. True parameters values are shown as red dots. fastsimcoal2 required 4–5 h for a single estimation based on 40 ECM cycles over parameters, whereas a run of
  requires on average 34 hours on a similar CPU.
Similar articles
-
Composite likelihood estimation of demographic parameters.BMC Genet. 2009 Nov 12;10:72. doi: 10.1186/1471-2156-10-72. BMC Genet. 2009. PMID: 19909534 Free PMC article.
-
Accuracy of Demographic Inferences from the Site Frequency Spectrum: The Case of the Yoruba Population.Genetics. 2017 May;206(1):439-449. doi: 10.1534/genetics.116.192708. Epub 2017 Mar 24. Genetics. 2017. PMID: 28341655 Free PMC article.
-
Modeling of African population history using f-statistics is biased when applying all previously proposed SNP ascertainment schemes.PLoS Genet. 2023 Sep 7;19(9):e1010931. doi: 10.1371/journal.pgen.1010931. eCollection 2023 Sep. PLoS Genet. 2023. PMID: 37676865 Free PMC article.
-
Inferring population size changes with sequence and SNP data: lessons from human bottlenecks.Heredity (Edinb). 2013 May;110(5):409-19. doi: 10.1038/hdy.2012.120. Epub 2013 Feb 20. Heredity (Edinb). 2013. PMID: 23423148 Free PMC article. Review.
-
Population genetic analysis of ascertained SNP data.Hum Genomics. 2004 Mar;1(3):218-24. doi: 10.1186/1479-7364-1-3-218. Hum Genomics. 2004. PMID: 15588481 Free PMC article. Review.
Cited by
-
Recent speciation associated with range expansion and a shift to self-fertilization in North American Arabidopsis.Nat Commun. 2022 Dec 8;13(1):7564. doi: 10.1038/s41467-022-35368-1. Nat Commun. 2022. PMID: 36481740 Free PMC article.
-
Reticulation, divergence, and the phylogeography-phylogenetics continuum.Proc Natl Acad Sci U S A. 2016 Jul 19;113(29):8025-32. doi: 10.1073/pnas.1601066113. Proc Natl Acad Sci U S A. 2016. PMID: 27432956 Free PMC article.
-
Toward a paradigm shift in comparative phylogeography driven by trait-based hypotheses.Proc Natl Acad Sci U S A. 2016 Jul 19;113(29):8018-24. doi: 10.1073/pnas.1601069113. Proc Natl Acad Sci U S A. 2016. PMID: 27432974 Free PMC article.
-
Demographic Reconstruction of Antarctic Fur Seals Supports the Krill Surplus Hypothesis.Genes (Basel). 2022 Mar 18;13(3):541. doi: 10.3390/genes13030541. Genes (Basel). 2022. PMID: 35328094 Free PMC article.
-
Meiotic sex in Chagas disease parasite Trypanosoma cruzi.Nat Commun. 2019 Sep 3;10(1):3972. doi: 10.1038/s41467-019-11771-z. Nat Commun. 2019. PMID: 31481692 Free PMC article.
References
-
- Beaumont MA, Nichols RA (1996) Evaluating loci for use in the genetic analysis of population structure. Proceedings of the Royal Society London B 263: 1619–1626.
Publication types
MeSH terms
LinkOut - more resources
Full Text Sources
Other Literature Sources
