. 2013 Oct 30;8(10):e74470.
doi: 10.1371/journal.pone.0074470. eCollection 2013.

Spatial bias in the marine fossil record

Affiliations

Spatial bias in the marine fossil record

Daril A Vilhena et al. PLoS One. .

Abstract

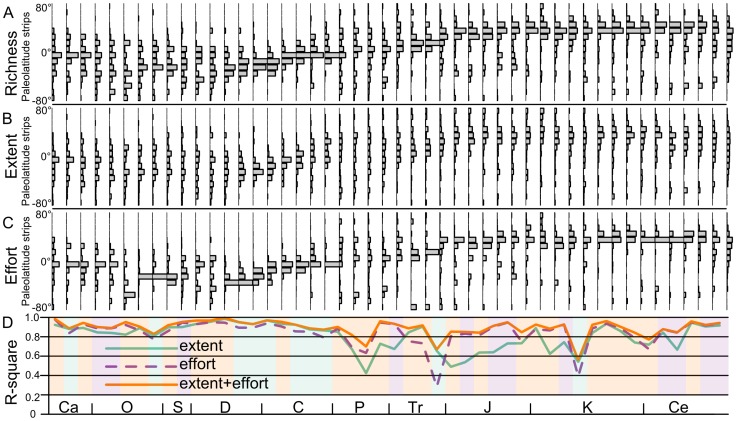
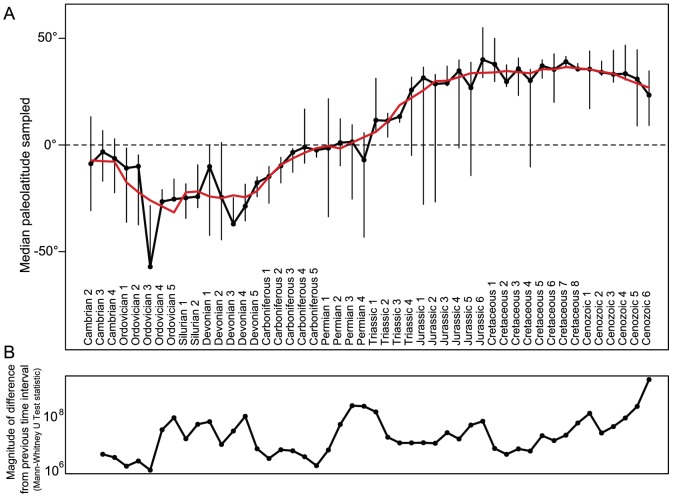
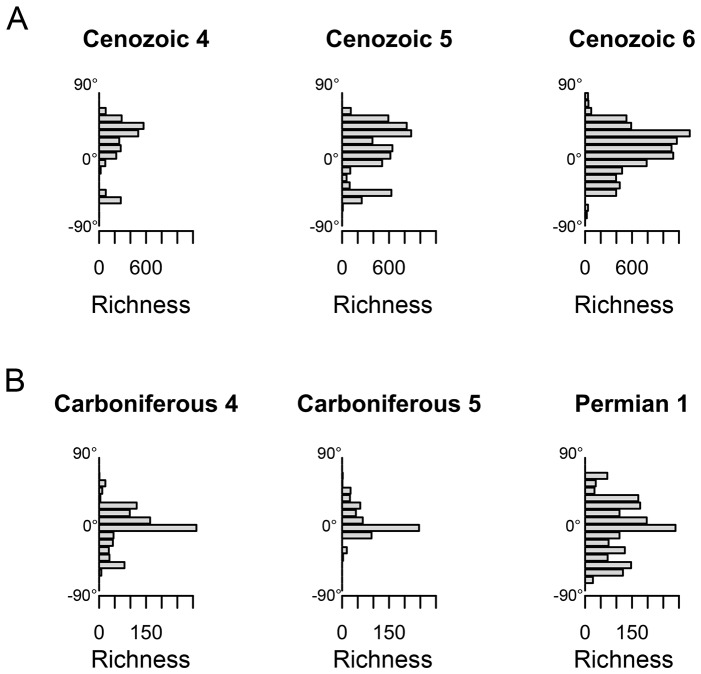
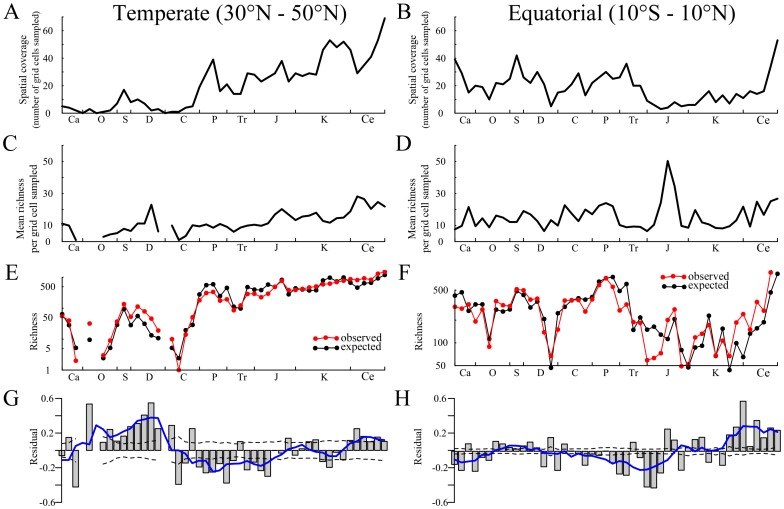
Inference of past and present global biodiversity requires enough global data to distinguish biological pattern from sampling artifact. Pertinently, many studies have exposed correlated relationships between richness and sampling in the fossil record, and methods to circumvent these biases have been proposed. Yet, these studies often ignore paleobiogeography, which is undeniably a critical component of ancient global diversity. Alarmingly, our global analysis of 481,613 marine fossils spread throughout the Phanerozoic reveals that where localities are and how intensively they have been sampled almost completely determines empirical spatial patterns of richness, suggesting no separation of biological pattern from sampling pattern. To overcome this, we analyze diversity using occurrence records drawn from two discrete paleolatitudinal bands which cover the bulk of the fossil data. After correcting the data for sampling bias, we find that these two bands have similar patterns of richness despite markedly different spatial coverage. Our findings suggest that i) long-term diversity trends result from large-scale tectonic evolution of the planet, ii) short-term diversity trends are region-specific, and iii) paleodiversity studies must constrain their analyses to well-sampled regions to uncover patterns not driven by sampling.


Conflict of interest statement

Competing Interests: The authors have declared that no competing interests exist.

Figures

Figure 1
Figure 1. 500,000 meter equal area gridding scheme for geographic coverage measure superimposed on a geographic map of the present day.
This measure is equal to the number of equal area cells in a paleolatitude strip with fossil occurrences of our target taxa.
Figure 2
Figure 2. Patterns of richness and sampling proxies through the Phanerozoic.
A) Distribution of genus richness across paleolatitude strips. B) Distribution of total equal area grid cells with at least one fossil locality recorded in the PaleoDB across paleolatitude strips. C) Distribution of faunal lists with collection IDs in the PaleoDB across paleolatitude strips. D) The percentage variation of richness in each paleolatitude strips explained by geographic coverage and sampling intensity in each of those paleolatitude strips. Note that the sampling proxies are not rendundant; parts of the Phanerozoic lack geographic coverage but have high sampling intensity and vice versa. Each interval is shaded by the color of the model with the lowest AIC score.
Figure 3
Figure 3. Spatial shifts in fossil occurrences through the Phanerozoic.
A) The median latitude of fossil occurrences steadily rises through the Phanerozoic, but is punctuated by short-term noise and contractions and expansions of geographic coverage. Error bars indicate 25th and 75th quantiles, while the red line is a moving average across five points. B) The Mann-Whitney U test statistic plotted for each interval. A higher test-statistic corresponds to a more severe change in latitude. All transitions are statistically significant but vary in their effect size.
Figure 4
Figure 4. The distribution of genus richness across latitudes plotted for key intervals.
A) For the last three Cenozoic time intervals (Cenozoic 4–6), Cenozoic 6 has more equitable sampling across latitudes than its predecessors. B) The Permo-Carboniferous boundary reflects a weakness in geographic coverage that biases estimates of global diversity inferred by subsampling.
Figure 5
Figure 5. Diversity and sampling bias in latitude strips.
A–B) Number of grid cells with sampled fossils for each time bin within two fixed paleolatiutudinal belts (temperate and equatorial). A gradual increase in sampled grid cells is evident in the temperate strip (A), while no such pattern is evident in the equatorial strip (B). C–D) Mean richness per sampled grid cell reveals no obvious pattern for faunas in the two paleolatitudinal belts. E–F) Null model that assumes biodiversity is driven purely by sampling (black) compared with observed genus richness (red). The null model explains the overall signal in the data, but select portions of the Phanerozoic deviate from the expectation. G–H) Plots show the difference between empirical richness and the expectation of the null model. Dashed bars indicate 99% confidence intervals for the null model. Overall, we find that the temperate and tropical faunas have similar trajectories despite markedly different trends in spatial sampling pattern over time.

References

    1. Brown JH, Maurer BA (1989) Macroecology: the division of food, space among species on continents. Science 243: 1145–1150. - PubMed
    1. Valentine JW, Jablonski D, Kidwell S, Roy K (2006) Assessing the fidelity of the fossil record by using marine bivalves. Proceedings of the National Academy of Sciences 103: 6599–6604. - PMC - PubMed
    1. Smith AB, Lloyd GT, McGowan AJ (2012) Phanerozoic marine diversity: rock record modelling provides an independent test of large-scale trends. Proceedings of the Royal Society B: Biological Sciences 279: 4489–4495. - PMC - PubMed
    1. Cherns L, Wright VP (2000) Missing molluscs as evidence of large-scale, early skeletal aragonite dissolution in a Silurian sea. Geology 28: 791–794.
    1. Cherns L, Wheeley JR, Wright VP (2011) Taphonomic bias in shelly faunas through time: early aragonitic dissolution, its implications for the fossil record. in: Taphonomy: Process, Bias Through Time, pp. 79–105.

LinkOut - more resources