. 2013 Oct 18;8(10):e76006.
doi: 10.1371/journal.pone.0076006. eCollection 2013.

Enterocyte proliferation and signaling are constitutively altered in celiac disease

Affiliations

Enterocyte proliferation and signaling are constitutively altered in celiac disease

Merlin Nanayakkara et al. PLoS One. .

Abstract

Celiac disease (CD) occurs frequently, and is caused by ingestion of prolamins from cereals in subjects with a genetic predisposition. The small intestinal damage depends on an intestinal stress/innate immune response to certain gliadin peptides (e.g., A-gliadin P31-43) in association with an adaptive immune response to other gliadin peptides (e.g., A-gliadin P57-68). Gliadin and peptide P31-43 affect epithelial growth factor receptor (EGFR) signaling and CD enterocyte proliferation. The reason why the stress/innate immune and proliferative responses to certain gliadin peptides are present in CD and not in control intestine is so far unknown. The aim of this work is to investigate if, in CD, a constitutive alteration of enterocyte proliferation and signaling exists that may represent a predisposing condition to the damaging effects of gliadin. Immunofluorescence and immunohistochemistry were used to study signaling in CD fibroblasts and intestinal biopsies. Western blot (WB) analysis, immunoprecipitation, and quantitative PCR were also used. We found in CD enterocytes enhancement of both proliferation and Epidermal Growth Factor Receptor (EGFR)/ligand system. In CD enterocytes and fibroblasts we found increase of the phosphorylated downstream signaling molecule Extracellular Signal Regulated Kinase (ERK); block of the ERK activation normalizes enterocytes proliferation in CD mucosa. In conclusion the same pathway, which gliadin and gliadin peptide P31-43 can interfere with, is constitutively altered in CD cells. This observation potentially explains the specificity of the damaging effects of certain gliadin peptides on CD intestine.


Conflict of interest statement

Competing Interests: The authors have declared that no competing interests exist.

Figures

Figure 1
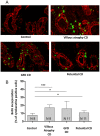
Figure 1. Proliferation of crypt enterocytes was increased in CD.
A. Immunofluorescence images of crypts from duodenal biopsies from a control, from a CD patient with villous atrophy, from a potential CD patient who were on a gluten-containing diet and from a GFD CD patient. Biopsies were cultured for 24 h with BrdU and then stained for cytokeratin to identify epithelial cells (red) and for BrdU (green) to identify proliferating cells. One representative experiment is shown. B. Quantitation of BrdU incorporation in intestinal biopsies. More than 300 cytokeratin-positive cells were counted in several fields in each sample; the number of BrdU- positive cells was expressed as a proportion of the total cytokeratin-positive cells. Columns represent the mean, bars the standard deviation, N. is the number of biopsies tested * = P<0.05; *** = P<0.001 (Student's t-test). One-way analysis of variance (ANOVA): P value = 0.0037 (4 groups, F = 5.437, R squared = 0.3242).
Figure 2
Figure 2. EGF mRNA and EGFR protein levels were increased in enterocytes of CD patients with villous atrophy and of GFD CD patients.
Example of selected crypt enterocytes from 5-micron sections of intestinal biopsies frozen and air dried before and after capture. For each sample, 300 crypt epithelial cells were captured. B) Semiquantitative PCR analysis of a biopsy from a CD patient with villous atrophy, a CD patient on GFD and a control. (a) PCR of GADPH, used as a loading control, one representative experiment is shown, c is the control lane without mRNA. (b) PCR of EGF, one representative experiment is shown, c is the control lane without mRNA. (c) statistical analysis of data obtained from 3 CD patients with villous atrophy, 3 CD patients on gluten-free diet (GFD) and 3 controls with gastro-esophageal reflux. Columns represent the mean, bars the standard deviation, * = P<0.05; ** = P<0.01 (Student's t-test). C. Immunofluorescence of CD patients and controls' biopsies stained with anti-EGFR antibody. 40× objective. C = control without primary antibody.
Figure 3
Figure 3. ERK was more phosphorylated in CD enterocytes.
Immunohistochemical images of crypts and villi of intestinal biopsies from CD patients and controls stained with an antibody that recognizes the phosphorylated form of ERK 1/2 (pY-ERK) and with hematoxylin/eosin. One representative experiment out of 5 independent experiments is shown. B. Statistical analysis of pY-ERK positive nuclei with respect to total nuclei in the enterocytes of the crypts and villi of 5 CD patients for each group and 5 controls. More than 300 pY-ERK- positive nuclei were counted in several fields in each sample on several slides. Columns represent means and bars standard deviation. * = P<0.05; *** = P<0.001 (Student's t-test). C. (a) Western blot analysis of biopsies from CD patients and controls stained with anti-pY-ERK and anti-ERK antibodies. Similar results were obtained in 5 subjects in each group. (b) Statistical analysis of WB of biopsies from 5 subjects for each group. Columns represent the mean, bars the standard deviation of the relative intensity of pY-ERK respect to total ERK protein. * = P<0.05; ** = P<0.01 (Student's t-test).
Figure 4
Figure 4. Increased proliferation of crypt enterocytes in CD depended on ERK activation.
Quantitation of BrdU incorporation in intestinal biopsies. More than 300 cytokeratin-positive cells were counted in several fields in each sample; the number of BrdU- positive cells was expressed as a proportion of the total cytokeratin-positive cells. Dots represent single patients before (UN) and after ERK inhibitor PD98059, treatment. The horizontal bar is the mediane. ** = P<0.01 (Mann Whitney Test).
Figure 5
Figure 5. Phosphorylation of EGFR, ERK and total proteins was increased in skin fibroblasts of CD patients.
Staining of total phosphorylated proteins in CD and controls fibroblasts. (a) Immunofluorescence of double staining with phalloidin (red) and anti-phosphotyrosin (green). Images obtained using a 63× objective (2× digital zoom) are shown. (b) Statistical analysis of fluorescence intensity/cell. For 5 patients and 4 controls, 3 independent experiments were done; in each experiment, the fluorescence intensity of 10 cells in random fields was measured. Columns represent means and bars standard deviation. * = P<0.05 (Student's t-test). B. Western blot analysis of total phosphorylated proteins in skin fibroblasts from CD patients on GFD and from controls. Phosphoproteins from CD patients and controls fibroblasts were lysates and immunoprecipitated (Ip), blotted and stained with anti-phosphotyrosine antibodies (blot anti-pY). The blots were stained again with anti-EGFR (blot anti-EGFR) and anti-ERK (blot anti-ERK) antibodies to identify the corresponding phosphorylated proteins. One representative experiment of 3 independent ones is shown for each subject (4 controls and 5 patients). C. Western blot analysis of phosphorylated ERK and EGFR in skin fibroblasts from CD patients on a GFD and from controls. (a) Western blot analysis of skin fibroblasts from CD patients and controls stained with anti-pY-ERK, anti-ERK and anti-tubulin antibodies. (b) Statistical analysis of WB obtained from 5 CD patients and 4 controls. Columns represent the mean, bars the standard deviation of the relative intensity of pY-ERK respect to total ERK protein. *** = P<0.001 (Student's t-test). (c) Western blot analysis of EGFR immunoprecipitated from skin fibroblasts and stained with anti-pY antibody. (d) Statistical analysis of WB obtained from 5 CD patients and 4 controls. Columns represent the mean, bars the standard deviation of the relative intensity of pY-EGFR respect to total EGFR protein** = P<0.01 (Student's t-test).

References

    1. Sollid LM (2000) Molecular basis of celiac disease. Annu Rev Immunol 18: 53–81. - PubMed
    1. Jabri B, Sollid LM (2006) Mechanisms of disease. Immuno-pathogenesis of Celiac disease. Nat Clin Pract Gastoenterol Hepathol 3: 516–525. - PubMed
    1. Abadie V, Sollid L, Barreiro LB, Jabri B (2010) Integration of genetic and immunological insights into a model of Celiac Disease pathogenesis. Annual Rev Immunol 29: 493–526. - PubMed
    1. Maiuri L, Ciacci C, Ricciardelli I, Vacca L, Raia V, et al. (2003) Association between innate response to gliadin and activation of pathogenic T cells in coeliac disease. Lancet 362: 30–37. - PubMed
    1. Hue S, Mention JJ, Monteiro RC, Zhang S, Cellier C, et al. (2004) A direct role for NKG2D/MICA interaction in villous atrophy during celiac disease. Immunity 21: 367–77. - PubMed

Publication types

MeSH terms

Substances