. 2013 Oct 28;8(10):e76096.
doi: 10.1371/journal.pone.0076096. eCollection 2013.

A method for selectively enriching microbial DNA from contaminating vertebrate host DNA

Affiliations

A method for selectively enriching microbial DNA from contaminating vertebrate host DNA

George R Feehery et al. PLoS One. .

Abstract

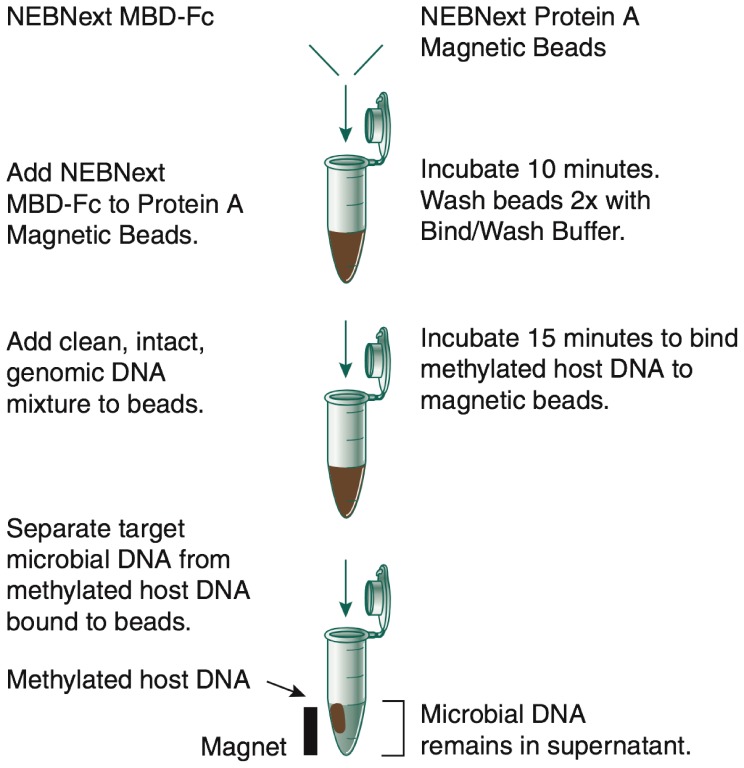
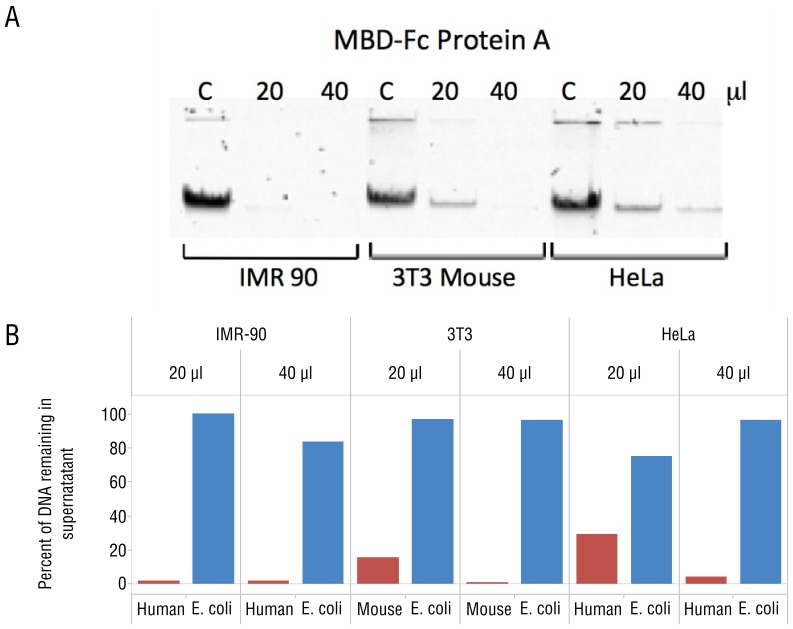
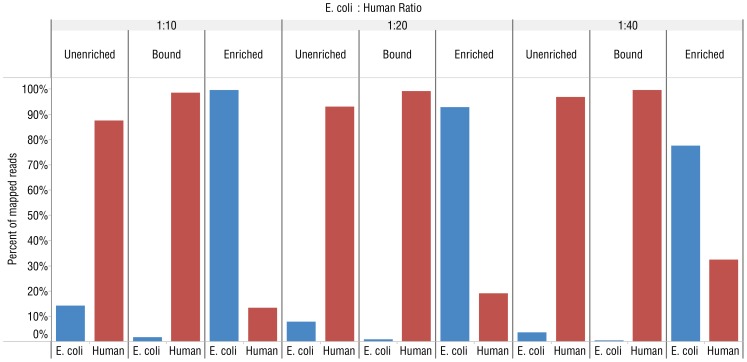
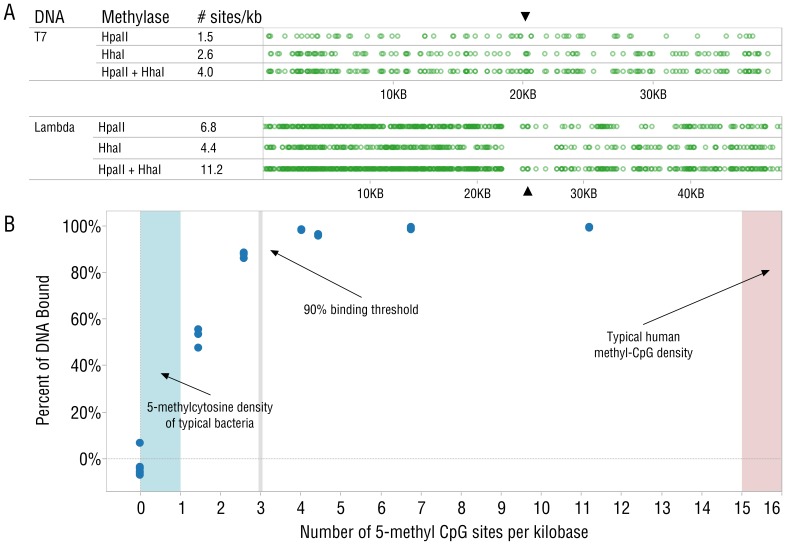
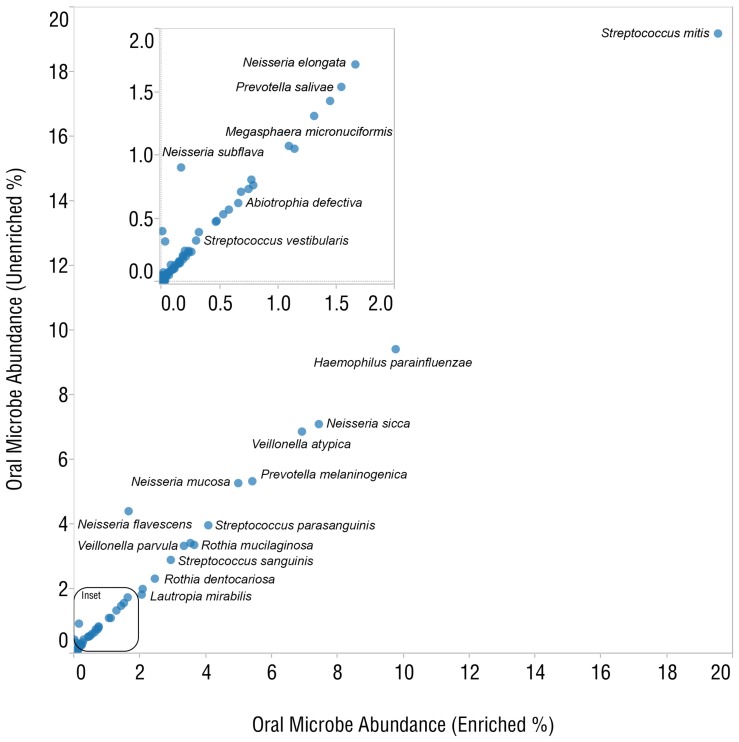
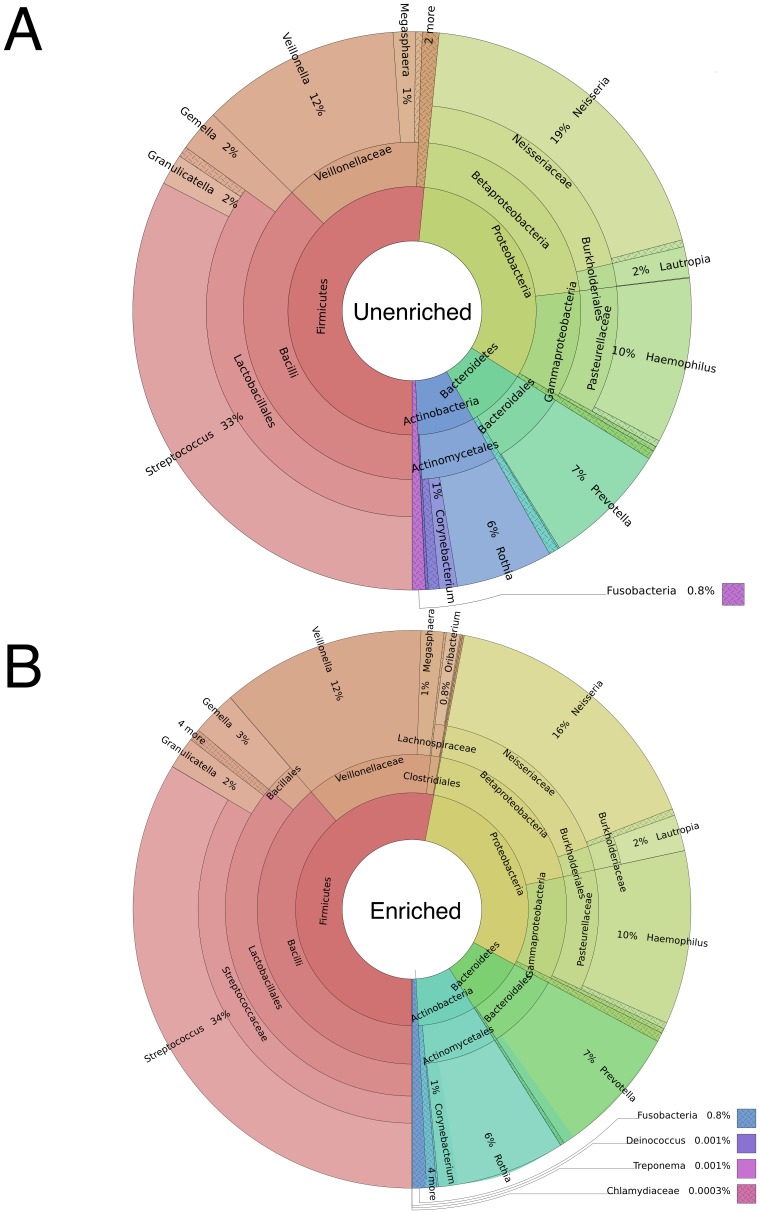
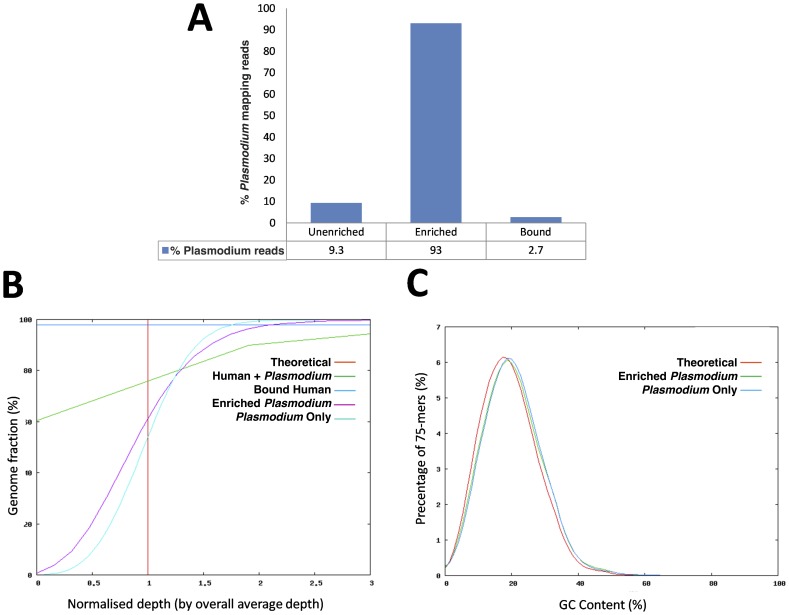
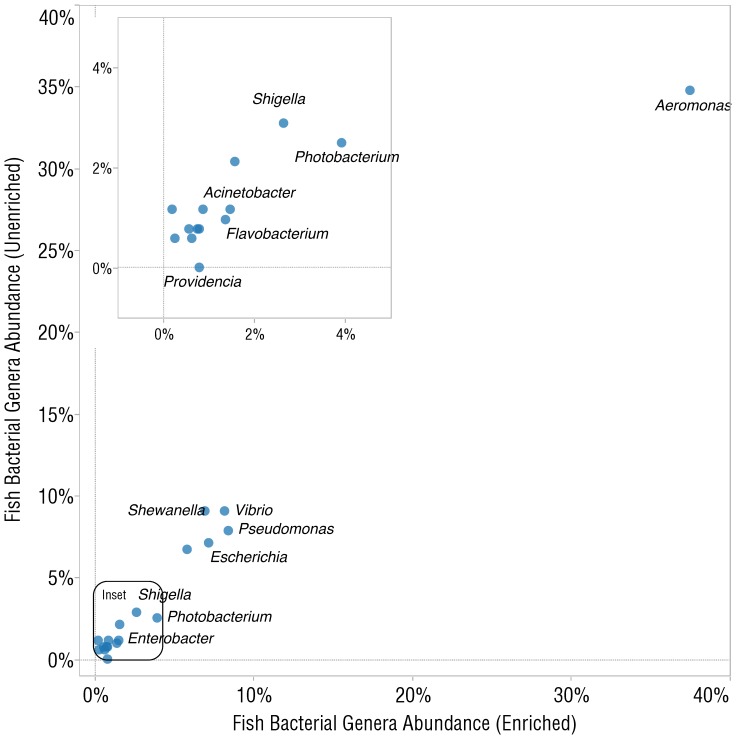
DNA samples derived from vertebrate skin, bodily cavities and body fluids contain both host and microbial DNA; the latter often present as a minor component. Consequently, DNA sequencing of a microbiome sample frequently yields reads originating from the microbe(s) of interest, but with a vast excess of host genome-derived reads. In this study, we used a methyl-CpG binding domain (MBD) to separate methylated host DNA from microbial DNA based on differences in CpG methylation density. MBD fused to the Fc region of a human antibody (MBD-Fc) binds strongly to protein A paramagnetic beads, forming an effective one-step enrichment complex that was used to remove human or fish host DNA from bacterial and protistan DNA for subsequent sequencing and analysis. We report enrichment of DNA samples from human saliva, human blood, a mock malaria-infected blood sample and a black molly fish. When reads were mapped to reference genomes, sequence reads aligning to host genomes decreased 50-fold, while bacterial and Plasmodium DNA sequences reads increased 8-11.5-fold. The Shannon-Wiener diversity index was calculated for 149 bacterial species in saliva before and after enrichment. Unenriched saliva had an index of 4.72, while the enriched sample had an index of 4.80. The similarity of these indices demonstrates that bacterial species diversity and relative phylotype abundance remain conserved in enriched samples. Enrichment using the MBD-Fc method holds promise for targeted microbiome sequence analysis across a broad range of sample types.


Conflict of interest statement

Competing Interests: GRF, EY, BWL, FJS, ETD, TD, and SP are employed by New England Biolabs and as such would benefit from the sale of kits containing the reagent described in the manuscript. SOO, VTS, LAZ and MAQ have declared that no competing interests exist. This does not alter the authors’ adherence to all the PLOS ONE policies on sharing data and materials.

Figures

Figure 1
Figure 1. A schematic diagram of microbiome DNA enrichment using MBD-Fc.
Figure 2
Figure 2. MBD-Fc fusions bind mammalian DNA.
(A) Gel image demonstrating depletions of mammalian DNA by MBD-Fc binding. A total amount of 250 ng input DNA was incubated with increasing amounts of MBD-Fc beads as indicated above the gel. “C” corresponds to a control reaction with no MBD-Fc beads in the incubation mixture. The unbound, supernatant fraction of each mixture was resolved and is shown on the gel image. (B) Separation and quantitation of bound (mammalian) and unbound (E. coli) DNA in a mixture containing DNA from both sources. Gel densitometry results are shown with increasing bead quantity in the depletion experiment. The percentage of E. coli DNA in the supernatant was calculated by 3H scintillation counting and comparing with the input counts per minute.
Figure 3
Figure 3. MBD-Fc enriches E. coli DNA from mixed E. coli and human DNA (IMR-90) samples.
Graphs showing the percentage of mapped reads from Ion Torrent PGM experiments to either the E. coli MG1655 or human hg19 reference genome from libraries made with different ratios of human to E. coli DNA. The ratio between E. coli to human DNA in the premixed samples is indicated above the figure. “Unenriched” refers to untreated, control mixtures. “Bound” indicates DNA that remained bound to MBD-Fc beads and “Enriched” corresponds to unbound DNA remaining in the supernatant.
Figure 4
Figure 4. MBD-Fc beads bind DNA efficiently when methyl-CpG density of 20 kb fragments is greater than 3 methyl-CpG groups per kilobase.
(A) Positions of CpG sites on T7 and Lambda DNA fragments (restriction sites indicated with ▴). (B) Graph representing the relationship between CpG site density and percent of DNA binding to the beads. Typical human methyl-CpG methylation density (red) and total 5-methylcytosine levels found in E. coli (blue) are shaded and indicated with arrows. Since it is not reported to have CpG methylation, E. coli DNA is not expected to bind the beads. Boundaries for the bacterial reference area are derived from chromatography results of nuclease digested DNA , since this represents the maximum possible amount of CpG methylation. Replicates of each methylation density are overlaid in this plot.
Figure 5
Figure 5. Analysis of SOLiD 4 sequence data from human saliva and blood samples before and after enrichment with MBD-Fc protein A paramagnetic beads.
(A) Unenriched control, enriched and, remaining after enrichment (bead bound) samples are indicated above the figure. The data reflect reads mapping to known oral microbes in HOMD . (B) Reads mapping to the PhageSeed database of viral sequences also show strong enrichment across two replicates.
Figure 6
Figure 6. A concordance plot compares relative abundances of oral microbes between unenriched and enriched samples.
Figure 7
Figure 7. Hierarchical pie plots show that species and hierarchy abundances are maintained between (A) unenriched and (B) enriched samples.
Figure 8
Figure 8. MBD-Fc separates human DNA from human-malarial DNA mixtures.
(A) Graph of the percentage of 75 bp Illumina reads mapping to the Plasmodium falciparum reference sequence in the mixture before enrichment (Unenriched), after enrichment (Enriched) and the bound fraction following wash and elution as described above (Bound). (B) Evenness of coverage analysis metrics show enriched malaria reads (Enriched Plasmodium) in line with pure malaria DNA reads (Plasmodium Only). Unlike the unenriched input sample (Human + Plasmodium) showing 60% of the Plasmodium genome uncovered (zero depth), enriched sample (Enriched Plasmodium) showed even coverage of the genome with no regions lacking coverage. The amount of Plasmodium DNA retained in the pellet (Bound Human) following wash and elution was insignificant. (C) GC-content and bias analysis. No base bias was detected in the enriched sample. Average GC content of the enriched sample (Enriched Plasmodium) matches the pure malaria sample (Plasmodium Only) and is very close to the theoretical GC coverage (Theoretical).
Figure 9
Figure 9. Analysis of Illumina sequence reads of a black molly (Poecilia cf. sphenops) whole fish DNA library before and after enrichment with MBD-Fc protein A paramagnetic beads.
Shown is a concordance plot comparing relative abundances of microbial genera between the enriched and unenriched samples.

References

    1. Bäckhed F, Ley RE, Sonnenburg JL, Peterson DA, Gordon JI (2005) Host-bacterial mutualism in the human intestine. Science (New York, NY) 307: 1915–1920. Available: http://www.ncbi.nlm.nih.gov/pubmed/15790844. Accessed 23 May 2013. - PubMed
    1. Fujimura KE, Slusher NA, Cabana MD, Lynch SV (2010) Role of the gut microbiota in defining human health. Expert Review of Anti-infective Therapy 8: 435–454. Available: http://www.pubmedcentral.nih.gov/articlerender.fcgi?artid=2881665&tool=p.... Accessed 20 June 2013. - PMC - PubMed
    1. Koren O, Spor A, Felin J, Fåk F, Stombaugh J, et al.. (2011) Human oral, gut, and plaque microbiota in patients with atherosclerosis. Proceedings of the National Academy of Sciences of the United States of America 108 Suppl: 4592–4598. Available: http://www.pubmedcentral.nih.gov/articlerender.fcgi?artid=3063583&tool=p.... Accessed 26 May 2013. - PMC - PubMed
    1. Liu B, Faller LL, Klitgord N, Mazumdar V, Ghodsi M, et al.. (2012) Deep sequencing of the oral microbiome reveals signatures of periodontal disease. PloS One 7: e37919. Available: http://www.pubmedcentral.nih.gov/articlerender.fcgi?artid=3366996&tool=p.... Accessed 27 May 2013. - PMC - PubMed
    1. Kinross JM, Darzi AW, Nicholson JK (2011) Gut microbiome-host interactions in health and disease. Genome Medicine 3: 14. Available: http://www.pubmedcentral.nih.gov/articlerender.fcgi?artid=3092099&tool=p.... Accessed 16 July 2013. - PMC - PubMed

Publication types

MeSH terms