Comparative Study
. 2013 Oct 24;8(10):e77869.
doi: 10.1371/journal.pone.0077869. eCollection 2013.

Difference in yield and physiological features in response to drought and salinity combined stress during anthesis in Tibetan wild and cultivated barleys

Affiliations
Comparative Study

Difference in yield and physiological features in response to drought and salinity combined stress during anthesis in Tibetan wild and cultivated barleys

Imrul Mosaddek Ahmed et al. PLoS One. .

Abstract

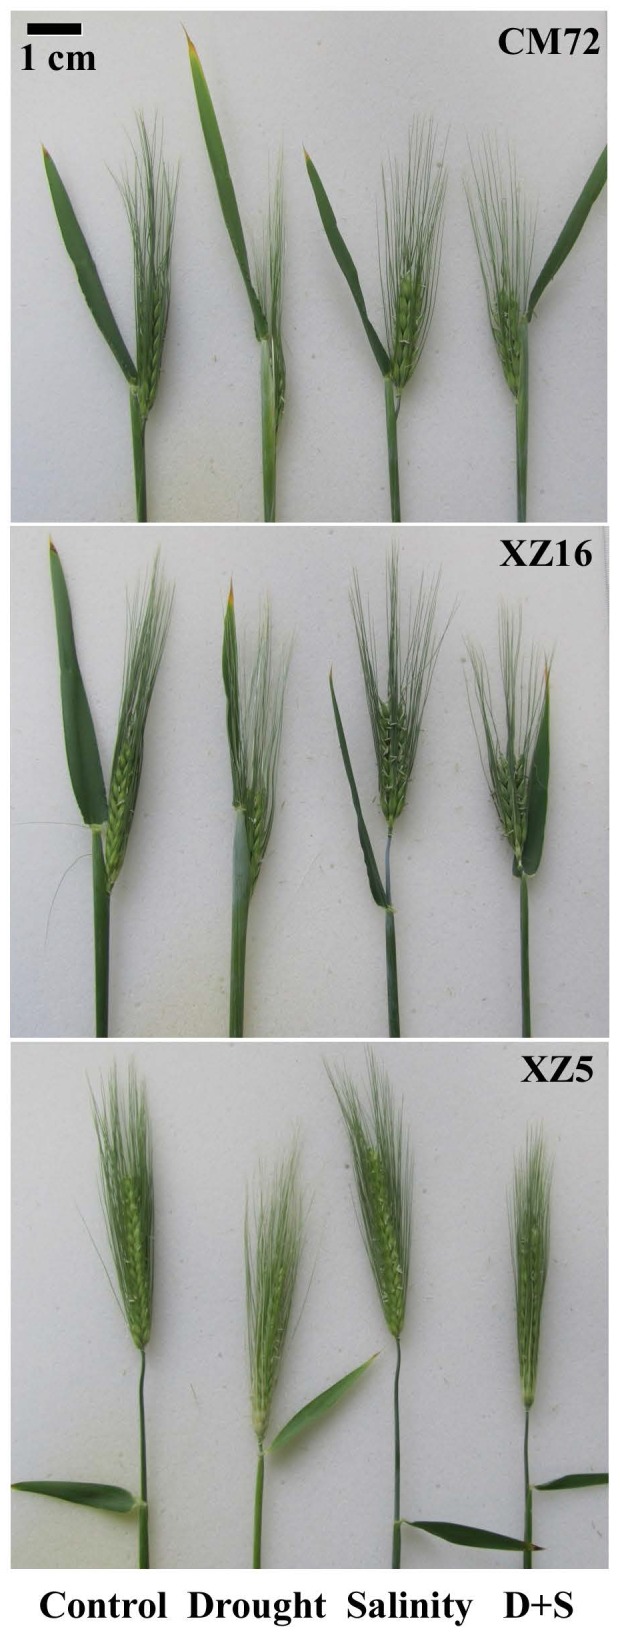
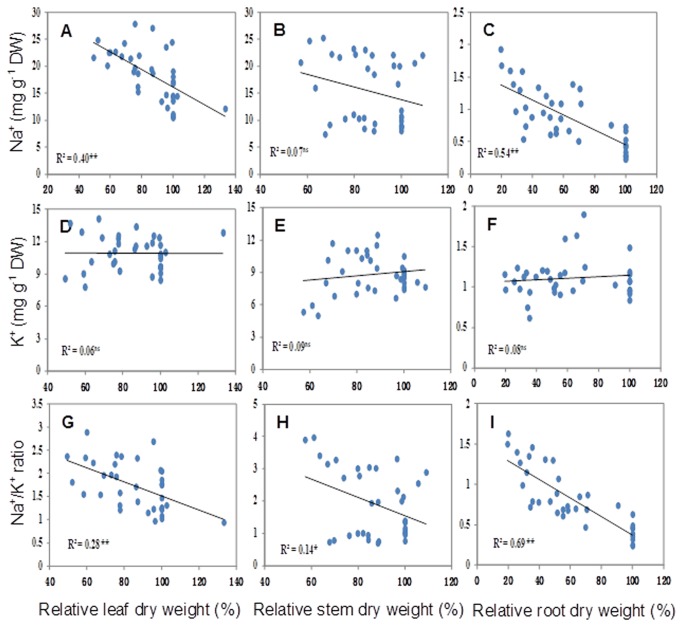
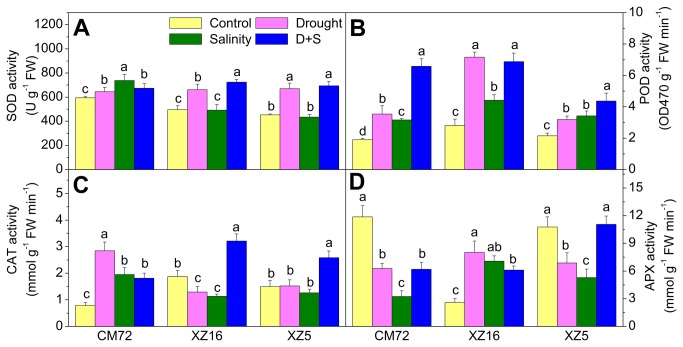
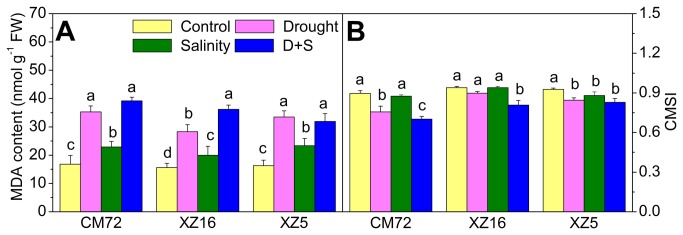
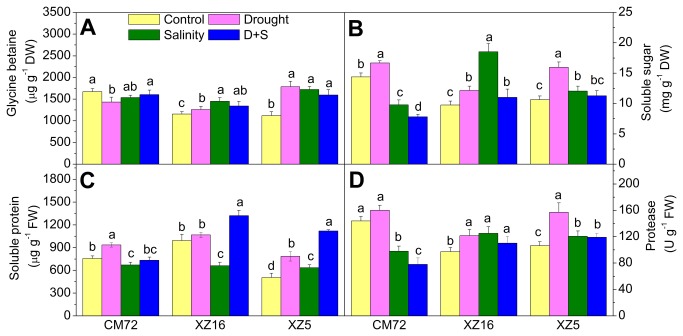
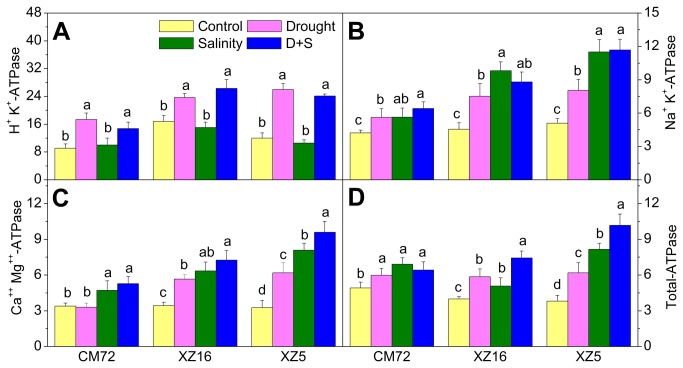
Soil salinity and drought are the two most common and frequently co-occurring abiotic stresses constraining crop growth and productivity. Greenhouse pot experiments were conducted to investigate the tolerance potential and mechanisms of Tibetan wild barley genotypes (XZ5, drought-tolerant; XZ16, salinity/aluminum tolerant) during anthesis compared with salinity-tolerant cv CM72 in response to separate and combined stresses (D+S) of drought (4% soil moisture, D) and salinity (S). Under salinity stress alone, plants had higher Na(+) concentrations in leaves than in roots and stems. Importantly, XZ5 and XZ16 had substantially increased leaf K(+) concentrations; XZ16 was more efficient in restricting Na(+) loading in leaf and maintained a lower leaf Na(+)/K(+) ratio. Moreover, a significant decrease in cell membrane stability index (CMSI) and an increase in malondialdehyde (MDA) were accompanied by a dramatic decrease in total biomass under D+S treatment. We demonstrated that glycine-betaine and soluble sugars increased significantly in XZ5 and XZ16 under all stress conditions, along with increases in protease activity and soluble protein contents. Significant increases were seen in reduced ascorbate (ASA) and reduced glutathione (GSH) contents, and in activities of H(+)K(+)-, Na(+)K(+)-, Ca(++)Mg(++)-, total- ATPase, and antioxidant enzymes under D+S treatment in XZ5 and XZ16 compared to CM72. Compared with control, all stress treatments significantly reduced grain yield and 1000-grain weight; however, XZ5 and XZ16 were less affected than CM72. Our results suggest that high tolerance to D+S stress in XZ5 and XZ16 is closely related to the lower Na(+)/K(+) ratio, and enhanced glycine-betaine and soluble protein and sugar contents, improved protease, ATPase activities and antioxidative capacity for scavenging reactive oxygen species during anthesis. These results may provide novel insight into the potential responses associated with increasing D+S stress in wild barley genotypes.


Conflict of interest statement

Competing Interests: The authors have declared that no competing interests exist.

Figures

Figure 1
Figure 1. Phenotype of spikes of cultivated and Tibetan wild barley genotypes.
Plants were affected by drought, salinity alone and combined stresses (D+S) during anthesis stage at 4% soil moisture level.
Figure 2
Figure 2. The correlation between relative dry weight and ionic concentration.
The correlation between Na+, K+ concentration and Na+/K+ ratios and relative leaf (A, D and G), stem (B, E and H) and root (C, F and I) dry weight based on three genotypes: CM72, XZ16 and XZ5. ns’ not significant, * and ** indicate significant at 0.05 and 0.01, respectively.
Figure 3
Figure 3. The antioxidant enzyme activities in cultivated and Tibetan wild barley genotypes.
Barley plants were exposed to alone and combined stresses of drought and salinity on superoxide dismutase (SOD, A) , peroxidase (POD, B), catalase (CAT, C) and ascorbate peroxidase (APX, D) in flag leaves of three barley genotypes during anthesis stage at 4% soil moisture level. Error bars represent SD values (n=4). Different letters indicate significant differences (P<0.05) among the treatments within each genotype. Control, drought, salinity and D+S correspond to normal growth condition without drought and salinity stress, drought stress (D, seedlings were subjected to drought stress for 20 d during anthesis by withholding irrigation until the soil moisture content (SMC) reduced to 4%), salinity stress (S, 1 L 200 mM NaCl solution was added per pot at anthesis stage and then kept humid throughout the experimental period), combined stresses of drought and salinity (D+S, 1 L 200 mM NaCl solution was added per pot at anthesis stage, then subjected to drought stress until SMC reduced to 4%), respectively.
Figure 4
Figure 4. MDA content and CMSI in flag leaves of Tibetan wild and cultivated barley genotypes.
Barley plants were exposed to drought, salinity alone and combined stresses during anthesis stage at 4% soil moisture level. Error bars represent SD values (n=4). Different letters indicate significant differences (P<0.05) among the treatments within each genotype. CMSI, cell membrane stability index; MDA, malondialdehyde;.
Figure 5
Figure 5. Glycine-betaine, soluble sugar, soluble protein and protease activity in flag leaves of three barley genotypes.
Tibetan wild and cultivated barley plants were exposed to drought, salinity alone and combined stresses during anthesis stage at 4% soil moisture level. Error bars represent SD values (n=4). Different letters indicate significant differences (P<0.05) among the treatments within each genotype.
Figure 6
Figure 6. Reduced glutathione (GSH), reduced ascorbate (ASA) and total phenol (TP) contents in flag leaves of barley genotypes.
Tibetan wild and cultivated barley plants were exposed to drought, salinity alone and combined stresses during anthesis stage at 4% soil moisture level. Error bars represent SD values (n=4). Different letters indicate significant differences (P<0.05) among the treatments within each genotype.
Figure 7
Figure 7. ATPase activity (µmol Pi mg−1 protein h−1) in flag leaves of three barley genotypes.
Tibetan wild and cultivated barley plants were exposed to drought, salinity alone and combined stresses during anthesis stage at 4% soil moisture level. Error bars represent SD values (n=4). Different letters indicate significant differences (P<0.05) among the treatments within each genotype.

References

    1. Chaves MM, Flexas J, Pinheiro C (2009) Photosynthesis under drought and salt stress: regulation mechanisms from whole plant to cell. Ann Bot 103: 551-560. PubMed: 18662937. - PMC - PubMed
    1. Munns R (2002) Comparative physiology of salt and water stress. Plant Cell Environ 25: 239-250. doi:10.1046/j.0016-8025.2001.00808.x. PubMed: 11841667. - DOI - PubMed
    1. Araus JL, Bort J, Steduto P, Villegas D, Royo C (2005) Breeding cereals for Mediterranean conditions: ecophysiological clues for biotechnology application. Ann Appl Biol 142: 129-141.
    1. Forster BP, Ellis RP, Moir J, Talame V, Sanguineti MC et al. (2004) Genotype and phenotype associations with drought tolerance in barley tested in North Africa. Ann Appl Biol 144: 157-168. doi:10.1111/j.1744-7348.2004.tb00329.x. - DOI
    1. Mahar AR, Hollington PA, Virk DS, Witcombe J (2003) Selection for early heading and salt-tolerance in bread wheat. Cereal Res Commun 31: 81-88.

Publication types

LinkOut - more resources