. 2013 Oct 21;8(10):e78045.
doi: 10.1371/journal.pone.0078045. eCollection 2013.

Cytokine induced phenotypic and epigenetic signatures are key to establishing specific macrophage phenotypes

Affiliations

Cytokine induced phenotypic and epigenetic signatures are key to establishing specific macrophage phenotypes

Nicolai A Kittan et al. PLoS One. .

Abstract

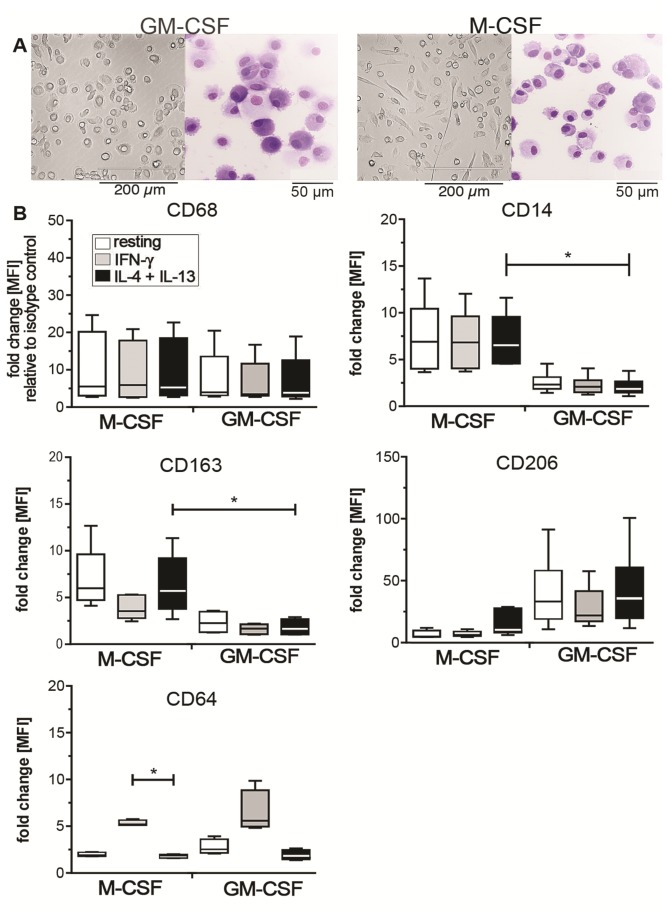
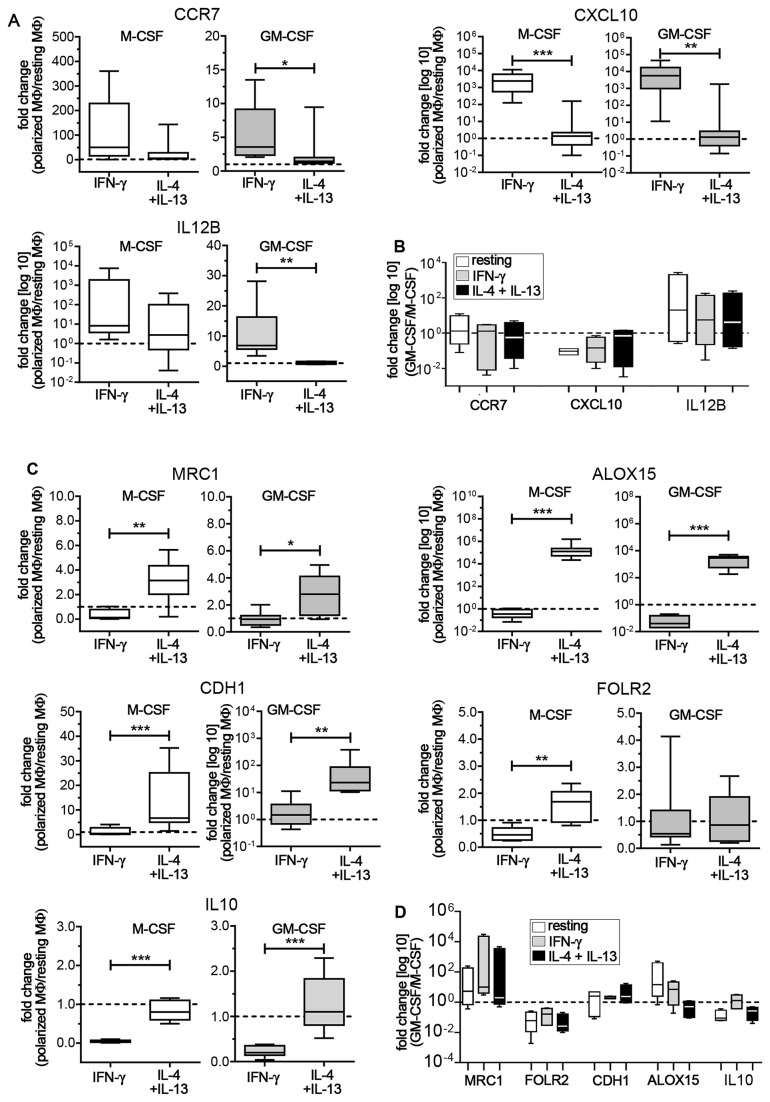
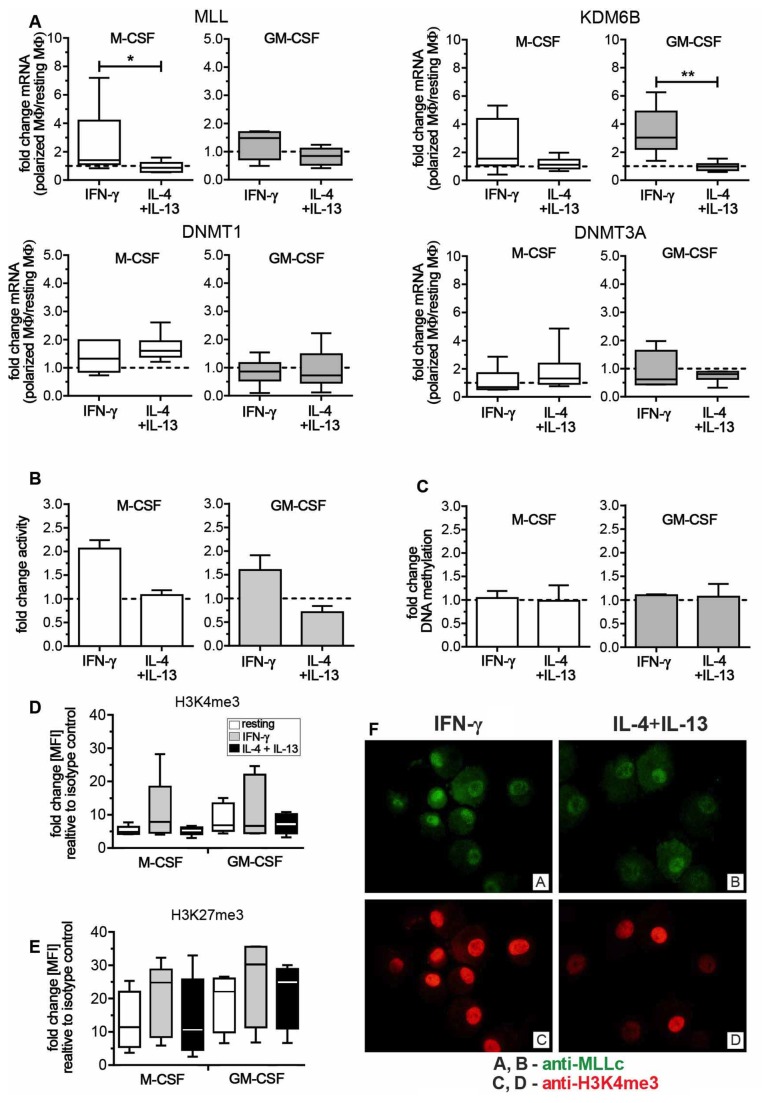
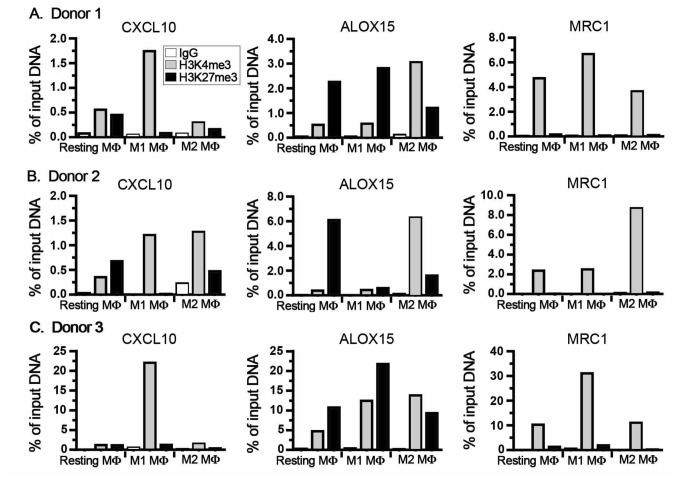
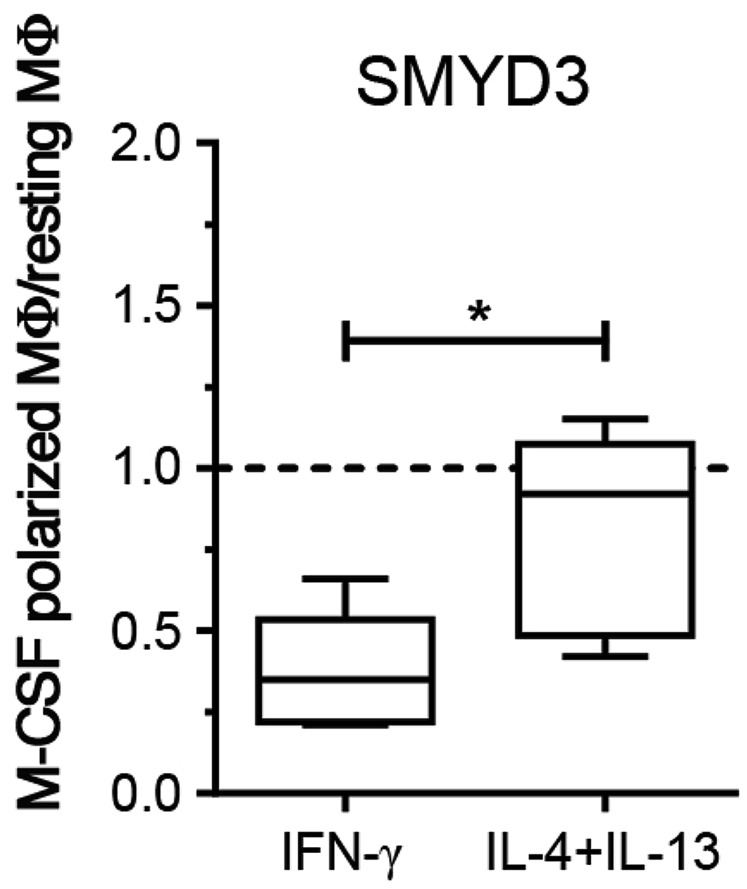
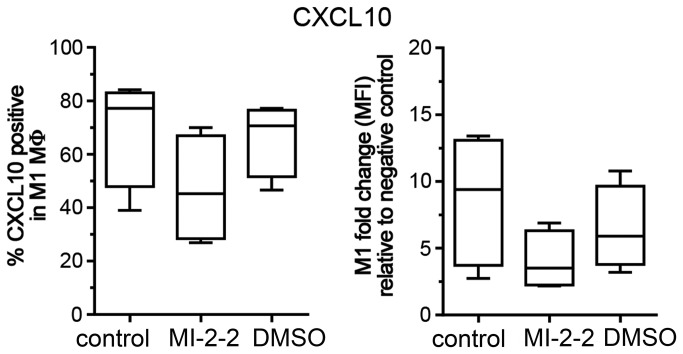
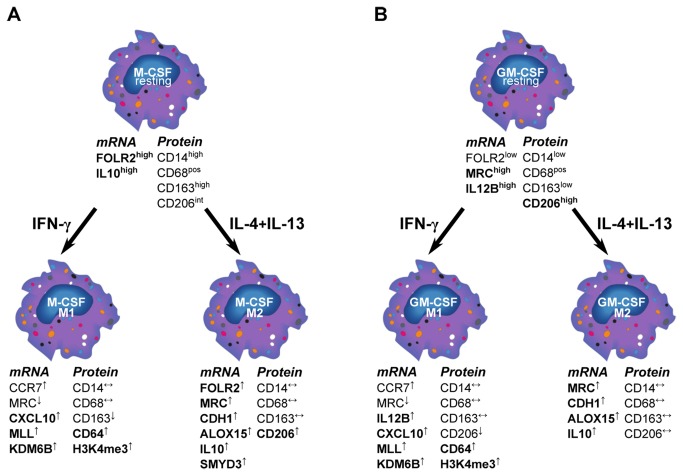
Macrophages (MΦ) play an essential role in innate immune responses and can either display a pro-inflammatory, classically activated phenotype (M1) or undergo an alternative activation program (M2) promoting immune regulation. M-CSF is used to differentiate monocytes into MΦ and IFN-γ or IL-4+IL-13 to further polarize these cells towards M1 or M2, respectively. Recently, differentiation using only GM-CSF or M-CSF has been described to induce a M1- or M2-like phenotype, respectively. In this study, we combined both approaches by differentiating human MΦ in GM-CSF or M-CSF followed by polarization with either IFN-γ or IL-4+IL-13. We describe the phenotypic differences between CD14(hi) CD163(hi) CD206(int) FOLR2-expressing M-CSF MΦ and CD14(lo) CD163(lo) CD206(hi) GM-CSF MΦ but show that both macrophage populations reacted similarly to further polarization with IFN-γ or IL-4+IL-13 with up- and down-regulation of common M1 and M2 marker genes. We also show that high expression of the mannose receptor (CD206), a marker of alternative activation, is a distinct feature of GM-CSF MΦ. Changes of the chromatin structure carried out by chromatin modification enzymes (CME) have been shown to regulate myeloid differentiation. We analyzed the expression patterns of CME during MΦ polarization and show that M1 up-regulate the histone methyltransferase MLL and demethylase KDM6B, while resting and M2 MΦ were characterized by DNA methyltransferases and histone deacetylases. We demonstrate that MLL regulates CXCL10 expression and that this effect could be abrogated using a MLL-Menin inhibitor. Taken together we describe the distinct phenotypic differences of GM-CSF or M-CSF MΦ and demonstrate that MΦ polarization is regulated by specific epigenetic mechanisms. In addition, we describe a novel role for MLL as marker for classical activation. Our findings provide new insights into MΦ polarization that could be helpful to distinguish MΦ activation states.


Conflict of interest statement

Competing Interests: The authors confirm that they will fully adhere to all the PLOS ONE policies. They received funding from Novartis. And two of the coauthors, Gabor Jarai and John Westwick, are (GJ) or were (JW) employed by the Novartis Institutes for Biomedical Research, UK. However, this does not alter the authors' adherence to all the PLOS ONE policies on sharing data and materials. The authors also have no other commercial interests to declare.

Figures

Figure 1
Figure 1. Phenotype of M-CSF and GM-CSF MΦ.
(A) Cell culture images and cytospin slides of M-CSF and GM-CSF MΦ on day+7 of culture before polarization. Images of cell cultures and cytospins were taken at a 20X magnification with an EVOS microscope (AMG) and at a 40X magnification using a Olympus BX43 microscope and CellSens 1.7 Software (Olympus), respectively. Adobe Photoshop CS5.1 (Adobe Systems) was used to adjust brightness and contrast. (B) Flow cytometric measurement of surface marker expression depicted as mean fluorescence intensity (MFI) relative to the isotype control in box plots for M-CSF and GM-CSF MΦ (4-5 donors). White bars indicate resting MΦ, grey bars indicate IFN-γ stimulated M1 MΦ, and black bars indicate IL-4+IL13 stimulated M2 MΦ. Box plots represent the median and interquartile range, whiskers indicate the minimum and maximum, respectively. * p < 0.05.
Figure 2
Figure 2. Expression of M1 and M2 marker genes.
In all these figures resting MΦ expression levels are indicated by the dotted line. (A) M-CSF (white box plots) and GM-CSF MΦ (grey box plots) were analyzed for mRNA expression of M1 genes. Data are expressed as fold differences of polarized MΦ relative to resting MΦ (6-8 donors). (B) Fold expression of M1 genes in GM-CSF MΦ relative to M-CSF MΦ (4 donors). White bars indicate resting MΦ, grey bars indicate IFN-γ stimulated M1 MΦ, and black bars indicate IL-4+IL13 stimulated M2 MΦ. (C) M2 gene expression in polarized MΦ relative to resting MΦ (7-8 donors). (D) Fold expression of M2 genes in GM-CSF MΦ relative M-CSF MΦ (4 donors). Bars are as described above in (B). Box plots represent the median and interquartile range; whiskers indicate the minimum and maximum, respectively. * p < 0.05, ** p < 0.01, *** p < 0.001.
Figure 3
Figure 3. Expression and functional analysis of chromatin modifying enzymes (CME).
In Figures A-C resting MΦ expression levels are indicated by the dotted line. (A) M-CSF (white box plots) and GM-CSF MΦ (grey box plots) were analyzed for mRNA expression of CME. Data are expressed as fold differences of polarized MΦ relative to resting MΦ (6-8 donors). Box plots represent the median and interquartile range, whiskers indicate the minimum and maximum, respectively. (B) Nuclear extracts of M-CSF (white bars) and GM-CSF MΦ (grey bars) were analyzed for H3K4-methyltransferase activity 24h after polarization (3 donors each). Data are expressed as relative absorbance of polarized MΦ relative to resting MΦ. Bars represent the median with range. (C) Genomic DNA of M-CSF (5 donors) and GM-CSF MΦ (4 donors) was analyzed for total DNA methylation 24h after polarization. Total DNA methylation is depicted as absorbance of polarized MΦ as relative to resting MΦ. Bars represent the median with range. (D) M-CSF MΦ and GM-CSF MΦ were polarized for 72h and stained for intracellular flow cytometry. MFI of H3K4me3 relative to the secondary antibody stain is shown for M-CSF and GM-CSF MΦ (5 donors). White bars indicate resting MΦ, grey bars indicate IFN-γ stimulated M1 MΦ, and black bars indicate IL-4+IL13 stimulated M2 MΦ. (E) MFI of H3K27me3 relative to the secondary antibody stain (4-5 donors). Bar codes are as described in (D). (F) Cytospin slides of M-CSF MΦ, polarized for 24h, were stained with anti-MLLc (upper panel) and anti-H3K4me3 (lower panel). Slides were analyzed using an Olympus BX43 microscope (Olympus) with a X-Cite®120Q excitation light source (Lumen Dynamics) and CellSens1.7 Software (Olympus). Adobe Photoshop CS5.1 (Adobe Systems) was used to adjust brightness and contrast. * p < 0.05, ** p < 0.01.
Figure 4
Figure 4. ChIP analysis for gene promoter-specific H3K4 and H3K27 trimethylation.
For ChIP analysis M-CSF MΦ were polarized for 48h and the promoter regions of CXCL10, ALOX15 and MRC1 were analyzed for enrichment of H3K4me3 and H3K27me3. Rabbit polyclonal IgG was used as negative control. Data are expressed as percent of input DNA. Data from 3 independent donors for control IgG (white bars), H3K4me3 (grey bars) and H3K27me3 (black bars) are shown.
Figure 5
Figure 5. SMYD3 expression in M-CSF MΦ.
M-CSF MΦ were polarized for 24h and analyzed for SMYD3 mRNA expression of M1. Data is expressed as fold differences of polarized MΦ relative to resting MΦ. Resting MΦ expression levels are indicated by the dotted line. (5 donors). Box plots represent the median and interquartile range; whiskers indicate the minimum and maximum, respectively. * p < 0.05.
Figure 6
Figure 6. Effect of targeting MLL-Menin interaction on CXCL10 protein expression.
Flow cytometric analysis of CXCL10 expression in M1 MΦ, pre-treated for 24h with 40µM of the MLL-Menin inhibitor MI-2-2 or DMSO 1:500. Results are shown as % of CXCL10 positive cells (left panel) and as MFI relative to the isotype control (right panel). Box plots represent the median and interquartile range, whiskers indicate the minimum and maximum, respectively.
Figure 7
Figure 7. Phenotype of polarized M-CSF and GM-CSF MΦ.
MΦ that were differentiated in M-CSF (A) and GM-CSF (B) were further polarized using IFN-γ or IL-4+IL-13. Characteristic features of M-CSF vs. GM-CSF MΦ are depicted in the upper part. Additional changes found in this study, induced by the polarization process are shown in the lower section with characteristic genes, surface markers and epigenetic changes for M-CSF and GM-CSF M1and M2 MΦ.

References

    1. Geissmann F, Manz MG, Jung S, Sieweke MH, Merad M et al. (2010) Development of monocytes, macrophages, and dendritic cells. Science 327: 656-661. doi:10.1126/science.1178331. PubMed: 20133564. - DOI - PMC - PubMed
    1. Gordon S, Taylor PR (2005) Monocyte and macrophage heterogeneity. Nat Rev Immunol 5: 953-964. doi:10.1038/nri1733. PubMed: 16322748. - DOI - PubMed
    1. Sica A, Mantovani A (2012) Macrophage plasticity and polarization: in vivo veritas. J Clin Invest 122: 787-795. doi:10.1172/JCI59643. PubMed: 22378047. - DOI - PMC - PubMed
    1. Mantovani A, Biswas SK, Galdiero MR, Sica A, Locati M (2013) Macrophage plasticity and polarization in tissue repair and remodelling. J Pathol 229: 176-185. doi:10.1002/path.4133. PubMed: 23096265. - DOI - PubMed
    1. Lacey DC, Achuthan A, Fleetwood AJ, Dinh H, Roiniotis J et al. (2012) Defining GM-CSF- and Macrophage-CSF-Dependent Macrophage Responses by In Vitro Models. J Immunol 188: 5752-5765. doi:10.4049/jimmunol.1103426. PubMed: 22547697. - DOI - PubMed

Publication types

MeSH terms

Substances