

AfroDb: a select highly potent and diverse natural product library from African medicinal plants
- PMID: 24205103
- PMCID: PMC3813505
- DOI: 10.1371/journal.pone.0078085
AfroDb: a select highly potent and diverse natural product library from African medicinal plants
Abstract
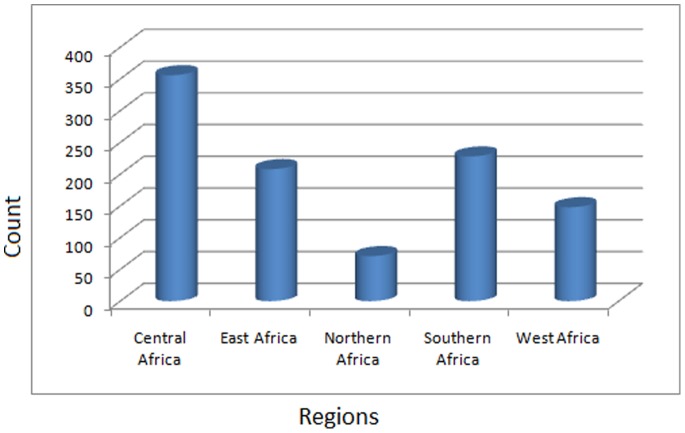
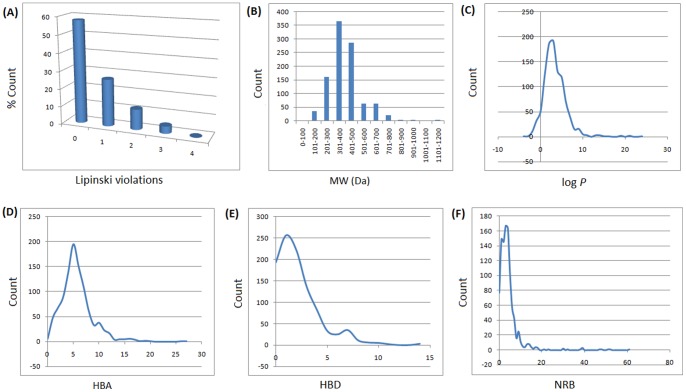
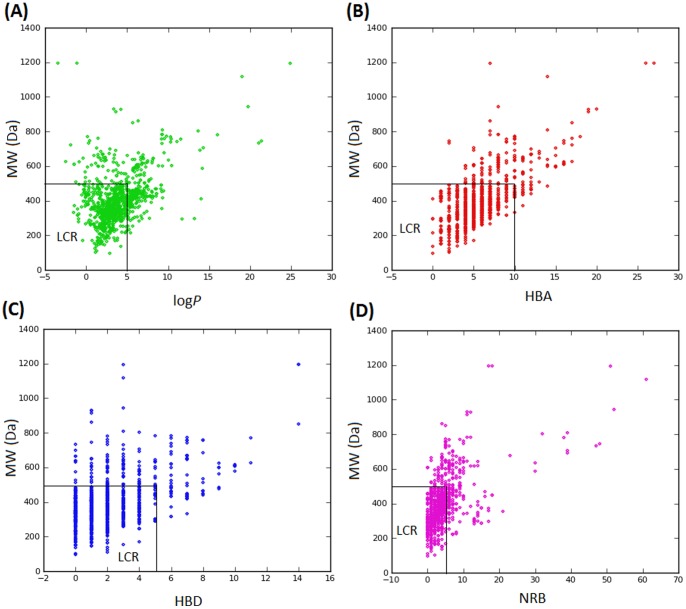
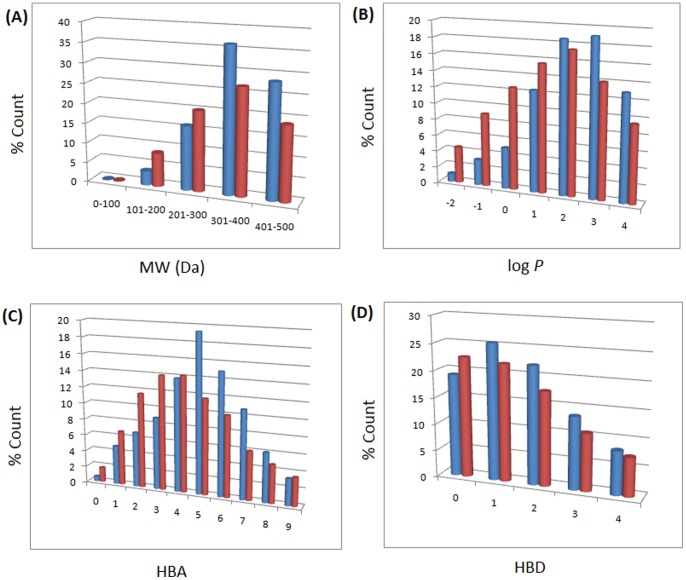
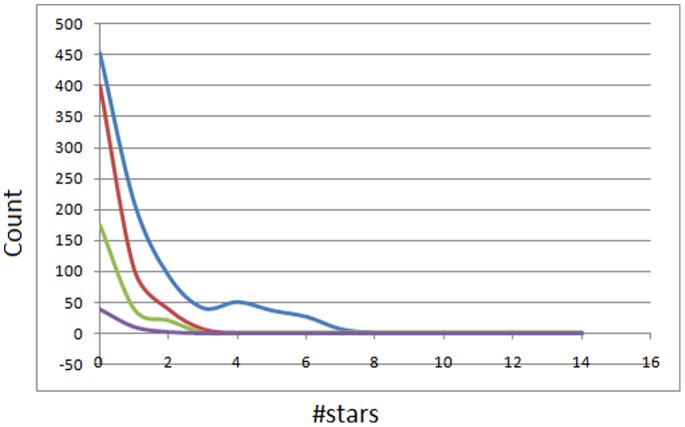
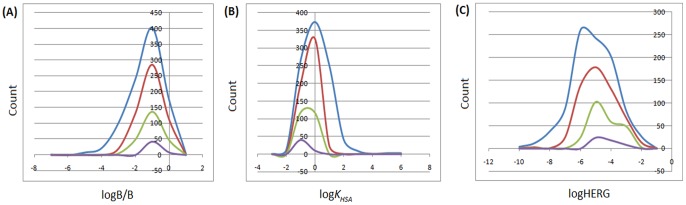
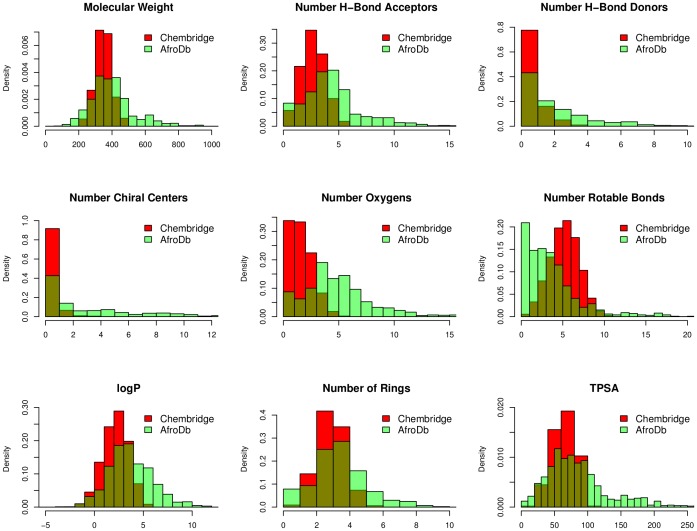
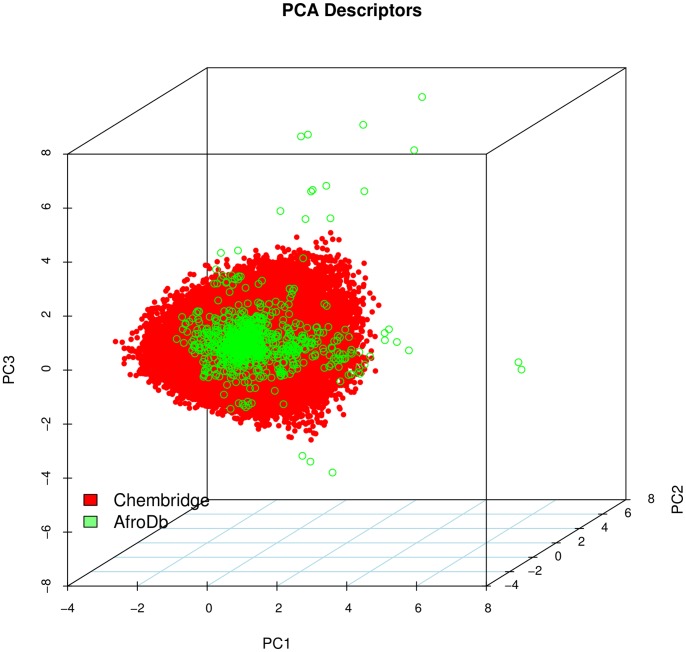
Computer-aided drug design (CADD) often involves virtual screening (VS) of large compound datasets and the availability of such is vital for drug discovery protocols. We assess the bioactivity and "drug-likeness" of a relatively small but structurally diverse dataset (containing >1,000 compounds) from African medicinal plants, which have been tested and proven a wide range of biological activities. The geographical regions of collection of the medicinal plants cover the entire continent of Africa, based on data from literature sources and information from traditional healers. For each isolated compound, the three dimensional (3D) structure has been used to calculate physico-chemical properties used in the prediction of oral bioavailability on the basis of Lipinski's "Rule of Five". A comparative analysis has been carried out with the "drug-like", "lead-like", and "fragment-like" subsets, as well as with the Dictionary of Natural Products. A diversity analysis has been carried out in comparison with the ChemBridge diverse database. Furthermore, descriptors related to absorption, distribution, metabolism, excretion and toxicity (ADMET) have been used to predict the pharmacokinetic profile of the compounds within the dataset. Our results prove that drug discovery, beginning with natural products from the African flora, could be highly promising. The 3D structures are available and could be useful for virtual screening and natural product lead generation programs.
Conflict of interest statement
Figures
Similar articles
-
CamMedNP: building the Cameroonian 3D structural natural products database for virtual screening.BMC Complement Altern Med. 2013 Apr 16;13:88. doi: 10.1186/1472-6882-13-88. BMC Complement Altern Med. 2013. PMID: 23590173 Free PMC article.
-
An in silico evaluation of the ADMET profile of the StreptomeDB database.Springerplus. 2013 Jul 30;2:353. doi: 10.1186/2193-1801-2-353. eCollection 2013. Springerplus. 2013. PMID: 23961417 Free PMC article.
-
Virtualizing the p-ANAPL library: a step towards drug discovery from African medicinal plants.PLoS One. 2014 Mar 5;9(3):e90655. doi: 10.1371/journal.pone.0090655. eCollection 2014. PLoS One. 2014. PMID: 24599120 Free PMC article.
-
The potential of anti-malarial compounds derived from African medicinal plants: a review of pharmacological evaluations from 2013 to 2019.Malar J. 2020 May 18;19(1):183. doi: 10.1186/s12936-020-03231-7. Malar J. 2020. PMID: 32423415 Free PMC article. Review.
-
Bioactive natural products derived from the Central African flora against neglected tropical diseases and HIV.Nat Prod Rep. 2013 Aug;30(8):1098-120. doi: 10.1039/c3np70030e. Epub 2013 Jul 2. Nat Prod Rep. 2013. PMID: 23817666 Review.
Cited by
-
Computer-aided identification of potential inhibitors against Necator americanus glutathione S-transferase 3.Inform Med Unlocked. 2022;30:100957. doi: 10.1016/j.imu.2022.100957. Inform Med Unlocked. 2022. PMID: 36570094 Free PMC article.
-
Natural products for infectious microbes and diseases: an overview of sources, compounds, and chemical diversities.Sci China Life Sci. 2022 Jun;65(6):1123-1145. doi: 10.1007/s11427-020-1959-5. Epub 2021 Oct 21. Sci China Life Sci. 2022. PMID: 34705221 Free PMC article. Review.
-
Cheminformatics Analysis and Modeling with MacrolactoneDB.Sci Rep. 2020 Apr 14;10(1):6284. doi: 10.1038/s41598-020-63192-4. Sci Rep. 2020. PMID: 32286395 Free PMC article.
-
Curcumin Encapsulation in Geranium Oil Microemulsion Elevates Its Antibacterial, Antioxidant, Anti-Inflammatory, and Anticancer Activities.ACS Omega. 2024 Jan 23;9(5):5624-5636. doi: 10.1021/acsomega.3c08033. eCollection 2024 Feb 6. ACS Omega. 2024. PMID: 38343911 Free PMC article.
-
In Silico Screening of Isocitrate Lyase for Novel Anti-Buruli Ulcer Natural Products Originating from Africa.Molecules. 2018 Jun 27;23(7):1550. doi: 10.3390/molecules23071550. Molecules. 2018. PMID: 29954088 Free PMC article.
References
-
- Akerele O (1993) In Summary of WHO guidelines for the assessment of herbal medicine. Herbalgram 28: 13–19.
-
- Potterat O, Hamburger M (2008) Drug discovery and development with plant-derived compounds. In: Petersen F, Amstutz R, editors. Progress in drug research: natural compounds as drugs. Birhäusser: Verlag AG. Pp. 45–118. - PubMed
-
- Li JWH, Vederas JC (2009) Drug discovery and natural products: end of an era or an endless frontier? Science 325: 161–165. - PubMed
-
- Quinn RJ, Carroll AR, Pham MB, Baron P, Palframan ME, et al. (2008) Developing a drug-like natural product library. J Nat Prod 71: 464–468. - PubMed
Publication types
MeSH terms
Substances
LinkOut - more resources
Full Text Sources
Other Literature Sources
