Clinical Trial
. 2013 Oct 30;8(10):e78748.
doi: 10.1371/journal.pone.0078748. eCollection 2013.

On the vertigo due to static magnetic fields

Affiliations
Clinical Trial

On the vertigo due to static magnetic fields

Omar S Mian et al. PLoS One. .

Abstract

Vertigo is sometimes experienced in and around MRI scanners. Mechanisms involving stimulation of the vestibular system by movement in magnetic fields or magnetic field spatial gradients have been proposed. However, it was recently shown that vestibular-dependent ocular nystagmus is evoked when stationary in homogenous static magnetic fields. The proposed mechanism involves Lorentz forces acting on endolymph to deflect semicircular canal (SCC) cupulae. To investigate whether vertigo arises from a similar mechanism we recorded qualitative and quantitative aspects of vertigo and 2D eye movements from supine healthy adults (n = 25) deprived of vision while pushed into the 7T static field of an MRI scanner. Exposures were variable and included up to 135s stationary at 7T. Nystagmus was mainly horizontal, persisted during long-exposures with partial decline, and reversed upon withdrawal. The dominant vertiginous perception with the head facing up was rotation in the horizontal plane (85% incidence) with a consistent direction across participants. With the head turned 90 degrees in yaw the perception did not transform into equivalent vertical plane rotation, indicating a context-dependency of the perception. During long exposures, illusory rotation lasted on average 50 s, including 42 s whilst stationary at 7T. Upon withdrawal, perception re-emerged and reversed, lasting on average 30 s. Onset fields for nystagmus and perception were significantly correlated (p<.05). Although perception did not persist as long as nystagmus, this is a known feature of continuous SSC stimulation. These observations, and others in the paper, are compatible with magnetic-field evoked-vertigo and nystagmus sharing a common mechanism. With this interpretation, response decay and reversal upon withdrawal from the field, are due to adaptation to continuous vestibular input. Although the study does not entirely exclude the possibility of mechanisms involving transient vestibular stimulation during movement in and out of the bore, we argue these are less likely.


Conflict of interest statement

Competing Interests: The authors have declared that no competing interests exist.

Figures

Figure 1
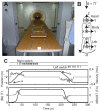
Figure 1. Experimental setup.
A) Photograph of custom-made track and bed in scanner room. The head started between the two asterisks, approximately 2.4 m from the entrance to the bore and 4 m to the centre of the bore. B) Head, body, and lab coordinate systems viewed from above participant lying on table. X-axes point out of page. For the head, the XY plane is in Reid's plane (the plane formed by the external auditory meati and the lower orbital margins). Rotation polarities are described according to the right-hand grip-rule (e.g. curved arrow depicts negative rotation direction about the X-axes). We also refer to head or trunk rotations about their X,Y, and Z axes as roll, pitch, and yaw respectively. When entering magnet head first, the direction of the static magnetic field (B) was in the head-to-toe (-Z) direction. The origin of the lab coordinate system is at the centre of the bore for the purpose of linear position descriptions. C) Example data from a long-duration exposure of experiment 2. Middle panel shows head position (black, left axes) and velocity (grey, right axes) along lab Z axis. Bottom panel shows magnetic field magnitude (black, left axes) and its temporal rate of change (grey, right axes) experienced by the head along the lab Z axis. Top panel shows raw voltage output from switches for logging perceived rotation (downward pulses depict depression of switches). We refer to the portion of the trial between the start of movement into the scanner (time a) and start of movement out of the scanner (time b) as the in-phase. Everything after time b is the out-phase.
Figure 2
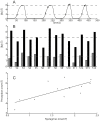
Figure 2. Thresholds of nystagmus and motion perception.
A) Data from single participant showing magnitude of the Z magnetic field (Bz) experienced by the head due to bed being pushed into and removed from the bore 4 times with overlayed open circles indicating points at which nystagmus onset was detected and solid circles indicating points at which onset of non-veridical motion perception was reported for each entry. There is no solid circle for the first entry because this is used as a perceptual scout entry (refer to main text). Horizontal lines represent mean across entries. B) Onset field for nystagmus (grey bars) and perception (black bars) for each participant and group means (horizontal lines). Nystagmus onset not obtained for S6 or S10. C) Perception onset plotted against nystagmus onset with linear regression line. Pearson correlation coefficient = 0.72 (p<.01).
Figure 3
Figure 3. Nystagmus slow phase velocity.
Horizontal (circles; Positive = leftward/+Z ocular rotation) and vertical (crosses, Positive =  downward/+Y ocular rotation) slow phase velocity (SPV; left axis) plotted over the magnitude of the Z magnetic field (BZ; grey; right axis) during a trial in experiment 2. The vertical lines indicate times at which the bed stops moving following entry into the magnet and stops moving following exit from the magnet.
Figure 4
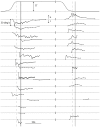
Figure 4. Perceived rotation velocity during long-duration exposures.
Solid curve at the top shows group average (relative to alignment events) BZ magnitude experienced by the head. Traces below show perceived rotation velocities for participants who perceived horizontal plane rotation in experiment 2 (16 of 19). Each dot represents time of switch press. Perceived horizontal velocities (upward = positive X, downward = negative X) are plotted relative to individual zero base-lines. The first button press is set to 0 deg/s, although the perceived speed is indeterminate at that point. Individual perceived velocity plots are vertically offset and arranged from top to bottom in descending order of duration of in-phase button presses. Plots have been split horizontally with each part aligned to different events represented by vertical dashed lines (left: aligned to time head reaches 7T during in-phase; right: aligned to time head reaches 0.2T during out-phase). Vertical shaded segments represent 95% confidence interval of the end of bed movement time relative to the alignment events.
Figure 5
Figure 5. Hypothetical and measured effects of head yaw orientation
. A and B are views from above participant lying supine on bed. Coordinate systems as in Figure 1B A) A signal of rotation about the head X-axis (illustrated here as a –X rotation vector) signals rotation in the horizontal plane (about lab X) when the head is neutral, and rotation in the vertical plane (about lab Y) when the head is turned in yaw. Note, the direction of the rotation vector in the vertical plane is reversed for head left vs head right yaw orientation. B) A signal of rotation about head Y-axis (illustrated here as a +Y rotation vector) signals rotation in the vertical plane (about lab Y) when the head is neutral, and rotation in the horizontal plane (about lab X) when the head is turned in yaw. Note the direction of rotation in the horizontal plane is reversed for head left vs head right yaw orientation. The head Z-axis will not change in body/lab coordinates as a consequence of head yaw orientation. C) Effect of head yaw orientation on mean±SD peak perceived horizontal plane rotation during in-phase and out-phase (Friedman's Test: in-phase, p<.05; out-phase, p<.05). When the reporting switches were being used, no participant (n = 5) reported perception of rotation during right yaw in-phase. However, one participant did report horizontal plane rotation during the equivalent preceding trial without switches, as did a participant who was excluded because of nausea. In both cases the direction was negative.

References

    1. Theysohn JM, Maderwald S, Kraff O, Moenninghoff C, Ladd ME, et al. (2008) Subjective acceptance of 7 Tesla MRI for human imaging. MAGMA 21: 63–72 10.1007/s10334-007-0095-x - DOI - PubMed
    1. Versluis MJ, Teeuwisse WM, Kan HE, van Buchem MA, Webb AG, et al. (2012) Subject tolerance of 7 T MRI examinations. J Magn Reson Imaging 000: 1–4 10.1002/jmri.23904 - DOI - PubMed
    1. Schenck JF, Dumoulin CL, Redington RW, Kressel HY, Elliott RT, et al. (1992) Human exposure to 4.0-Tesla magnetic fields in a whole-body scanner. Med Phys 19: 1089–1098. - PubMed
    1. Glover PM, Cavin I, Qian W, Bowtell R, Gowland PA (2007) Magnetic-field-induced vertigo: a theoretical and experimental investigation. Bioelectromagnetics 28: 349–361 10.1002/bem.20316 - DOI - PubMed
    1. Cavin ID, Glover PM, Bowtell RW, Gowland PA (2007) Thresholds for perceiving metallic taste at high magnetic field. J Magn Reson Imaging 26: 1357–1361 10.1002/jmri.21153 - DOI - PubMed

Publication types