. 2013 Oct 24;8(10):e78764.
doi: 10.1371/journal.pone.0078764. eCollection 2013.

Aqueous ethanolic extract of Tinospora cordifolia as a potential candidate for differentiation based therapy of glioblastomas

Affiliations

Aqueous ethanolic extract of Tinospora cordifolia as a potential candidate for differentiation based therapy of glioblastomas

Rachana Mishra et al. PLoS One. .

Abstract

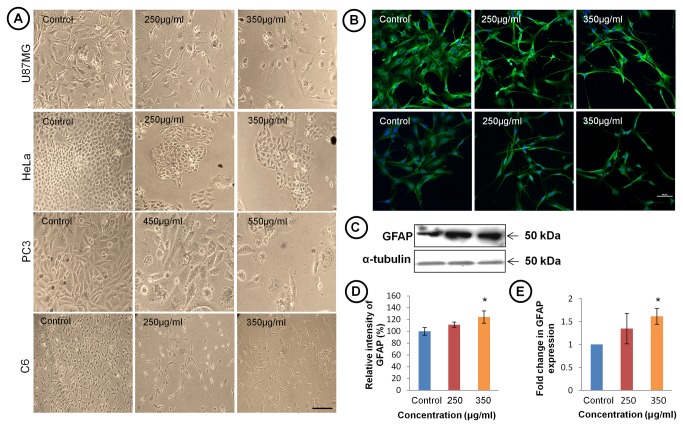
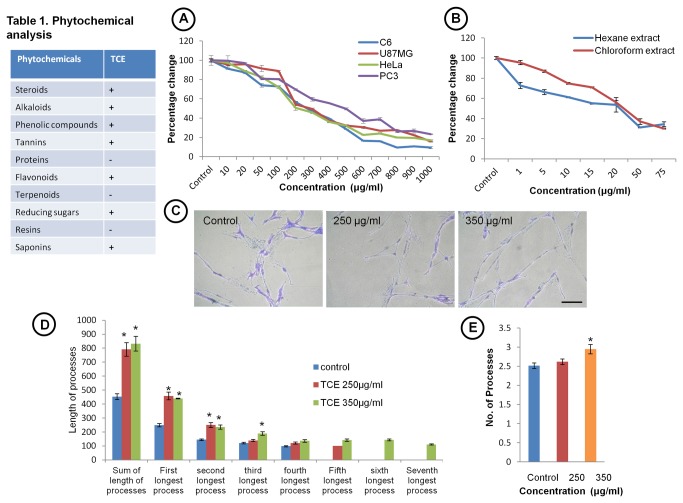
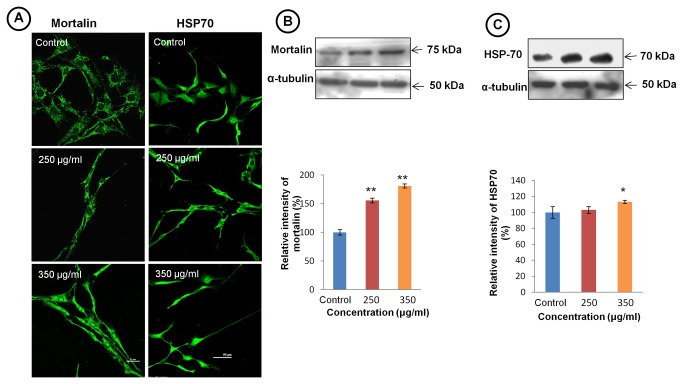
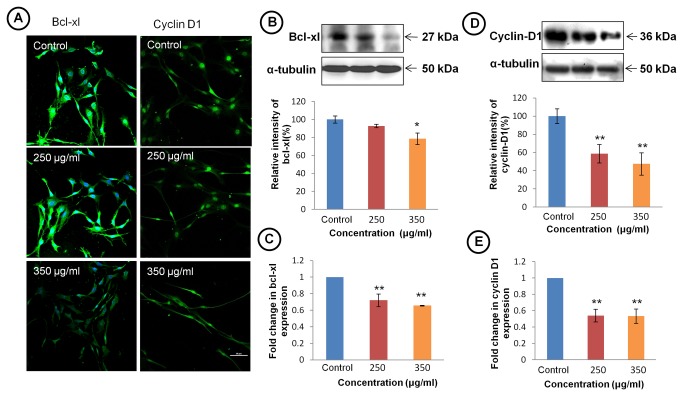
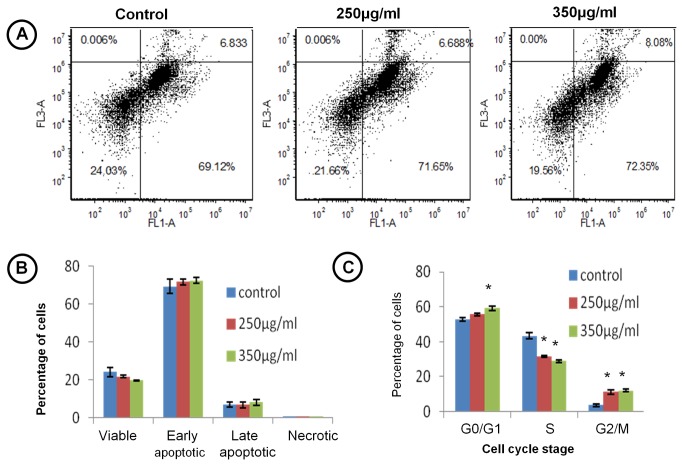
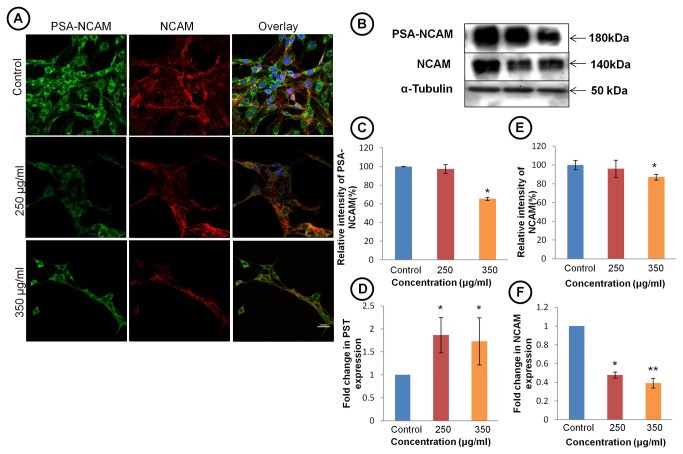
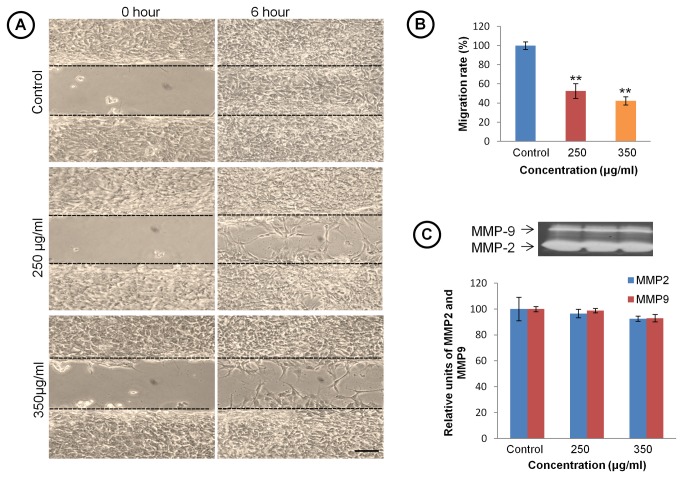
Glioblastomas are the most aggressive primary brain tumors and their heterogeneity and complexity often renders them non responsive to various conventional treatments. Search for herbal products having potential anti-cancer activity is an active area of research in the Indian traditional system of medicine i.e., Ayurveda. Tinospora cordifolia, also named as 'heavenly elixir' is used in various ayurvedic decoctions as panacea to treat several body ailments. The current study investigated the anti-brain cancer potential of 50% ethanolic extract of Tinospora cordifolia (TCE) using C6 glioma cells. TCE significantly reduced cell proliferation in dose-dependent manner and induced differentiation in C6 glioma cells, resulting in astrocyte-like morphology as indicated by phase contrast images, GFAP expression and process outgrowth data of TCE treated cells which exhibited higher number and longer processes than untreated cells. Reduced proliferation of cells was accompanied by enhanced expression of senescence marker, mortalin and its translocation from perinuclear to pancytoplasmic spaces. Further, TCE showed anti-migratory and anti-invasive potential as depicted by wound scratch assay and reduced expression of plasticity markers NCAM and PSA-NCAM along with MMP-2 and 9. On analysis of the cell cycle and apoptotic markers, TCE treatment was seen to arrest the C6 cells in G0/G1 and G2/M phase, suppressing expression of G1/S phase specific protein cyclin D1 and anti-apoptotic protein Bcl-xL, thus supporting its anti-proliferative and apoptosis inducing potential. Present study provides the first evidence for the presence of anti-proliferative, differentiation-inducing and anti-migratory/anti-metastatic potential of TCE in glioma cells and possible signaling pathways involved in its mode of action. Our primary data suggests that TCE and its active components may prove to be promising phytotherapeutic interventions in gliobalstoma multiformae.


Conflict of interest statement

Competing Interests: The authors have declared that no competing interests exist.

Figures

Figure 1
Figure 1. TCE Induces differentiation in U87MG, HeLa, PC3 and C6 cells.
(A) Phase contrast photomicrographs of U87MG, HeLa, PC3 and C6 cell lines treated with TCE showing gradual changes from undifferentiated to highly differentiated morphology. Scale bar- 200 μm. (B) Confocal images of C6 glioma cells showing α-tubulin (upper panel) and GFAP (lower panel) expression. Scale bar- 50 μm. (C) Representative western blot hybridization signals of GFAP expression. (D) Histogram showing densitometric analysis of GFAP protein bands in western blotting in TCE treated and control groups. (E) Histograms representing mRNA expression of GFAP in control and treated groups. Gene expression is represented by ΔΔCt value of GFAP after normalising with 18S RNA as endogenous control. Values are presented as mean ± SEM of at least three independent experiments. ‘*’ (P<0.05) and ‘**’ (p< 0.01) represent statistical significant difference between control and TCE treated groups.
Figure 2
Figure 2. TCE treatment inhibits cell proliferation and induces process outgrowth.
(Table 1) Phytochemical analysis of TCE. (A) MTT assay showing dose dependent decrease in cell number in TCE treated U87MG, HeLa, PC3 and C6 cells. Graph showing IC50 for U87MG, HeLa and C6 cells at 200 μg/ml and for PC3 cells at 500 μg/ml. (B) MTT assay showing the effect of hexane and chloroform fractions on C6 glioma cells. (C) Bright field images of cells stained with 1% toluidine blue and 1% methylene blue after fixing with glutaraldehyde. Scale bar-200 μm. (D) Histogram representing length of total and individual cell processes in TCE treated and control cells. At least 100 cells from each sample in every experiment were counted for process outgrowth analysis. (E) Histogram showing average of number of processes in TCE treated and untreated cells. Values are representative of mean ± SEM. ‘*’ (P<0.05) and ‘**’ (p< 0.01) represent statistical significant difference between control and TCE treated groups.
Figure 3
Figure 3. TCE treatment induces senescence in C6 glioma cells.
(A) Representative confocal images of C6 glioma cells immunostained for mortalin (left panel) showing shift of immunostaining from perinuclear to pancytoplasmic and then to nucleus at higher dose (Scale bar- 25 μm). Immunostaining of C6 cells for HSP 70 (right panel) shows differential expression of HSP70 in TCE treated cells (Scale bar- 50 μm). (B) Representative western blot hybridization signals of mortalin. Histogram representing percentage change in mortalin expression in TCE treated and control group. (C) Representative western blot hybridization signals of HSP 70 expression. Histogram representing percentage change in expression of HSP 70 in TCE treated and control group. Values are presented as mean ± SEM. ‘*’ (P<0.05) and ‘**’ (p< 0.01) represent statistical significant difference between control and TCE treated groups.
Figure 4
Figure 4. TCE inhibits anti-apoptosis and cell cycle promoting genes.
(A) Confocal images of immunostaining of bcl-xl (left panel) and cell cycle regulator protein cyclin D1 (right panel) in TCE treated and untreated C6 cells (Scale bar- 50 μm). (B) Representative western blot hybridization signals of bcl-xl (upper panel). Histogram (lower panel) representing the relative change in expression of bcl-xl. (C) Histograms representing expression of mRNA of bcl-xl in control and treated cells. Gene expression is represented by ΔΔCt value of bcl-xl after normalising with 18S RNA as endogenous control. (D) Representative western blot hybridization signals of cyclin D1 in TCE treated and control group (upper panel). Histogram (lower panel) represents relative change in expression of cyclin D1. (E) Histograms representing expression of mRNA of cyclin D1 in control and treated cells. Gene expression is represented by ΔΔCt value of cyclin D1 after normalising with 18S RNA as endogenous control. Values are presented as mean ± SEM of at least three independent experiments. ‘*’ (P<0.05) and ‘**’ (p< 0.01) represent statistical significant difference between control and TCE treated groups.
Figure 5
Figure 5. TCE induces apoptosis and cell cycle arrest.
(A) Distribution of viable, early apoptotic, late apoptotic and necrotic cells analysed by extent of expression of annexin V on the surface of cells and total PI uptake by flow cytometer. (B) Histogram showing percentage of cells in viable, early apoptotic, late apoptotic and necrotic stages. (C) Histogram representing distribution of cells in G0/G1, S and G2/M phase of cell cycle analysed by PI stain using flow cytometer. ‘*’ represents statistical significant difference (p<0.05) between control and TCE treated group.
Figure 6
Figure 6. TCE reduces expression of NCAM and PSA-NCAM.
(A) Immunostaining for PSA-NCAM and NCAM in TCE treated and untreated C6 cells (Scale bar- 25 μm). (B) Extent of glycosylation of NCAM estimation by western blot analysis using anti-PSA-NCAM antibody (upper panel). Middle panel represents total NCAM expression. (C) Histogram representing percentage change in expression of PSA-NCAM in TCE treated and control cells. (D) Histograms representing expression of mRNA of PST (enzyme responsible for polysialylation of NCAM moiety) in control and treated cells. Gene expression is represented by ΔΔCt value of PST after normalising with 18S RNA as endogenous control. (E) Histogram presenting densitometric analysis of western blot of NCAM showing decrease in expression of NCAM in dose dependent manner in C6 glioma cells. (F) Histograms representing expression of mRNA of NCAM in control and treated cells. Gene expression is represented by ΔΔCt value of NCAM after normalising with 18S RNA as endogenous control. Values are presented as mean ± SEM. ‘*’ (P<0.05) and ‘**’ (p< 0.01) represent statistical significant difference between control and TCE treated groups.
Figure 7
Figure 7. TCE exhibit anti-migratory property in C6 glioma cells.
(A) Representative Phase contrast images of C6 glioma cells in wound scratch assay to analyze motility of C6 cells. Images show the width of scratch at zero hour and after 6h with and without TCE treatment (Scale bar- 200 μm). (B) Histogram representing percentage change in migration rate of C6 glioma cells in TCE treated group. Values are presented as mean± SEM. (C) Representative MMP zymogram for control and TCE treated groups. Histogram represents densitometric analysis of MMP bands. . ‘*’ (P<0.05) and ‘**’ (p< 0.01) represent statistical significance difference between control and TCE treated groups.

References

    1. Nair RB, Nair KV, Nair AR, Nair CP (1992) Anti diabetic activity of amrithadi churnam. Anc Sci Life 12(1-2): 280-285. PubMed: 22556603. - PMC - PubMed
    1. Guruprasad KP, Mascarenhas R, Gopinath PM, Satyamoorthy K (2010) Studies on Brahma rasayana in male swiss albino mice: Chromosomal aberrations and sperm abnormalities. J Ayurveda Integr Med 1(1): 40-44. doi:10.4103/0975-9476.59826. PubMed: 21829300. - DOI - PMC - PubMed
    1. Bishayi B, Roychowdhury S, Ghosh S, Sengupta M (2002) Hepatoprotective and immunomodulatory properties of Tinospora cordifolia in CCl4 intoxicated mature albino rats. J Toxicol Sci 27(3): 139-146. doi:10.2131/jts.27.139. PubMed: 12238138. - DOI - PubMed
    1. Sharma V, Pandey D (2010) Protective Role of Tinospora cordifolia against Lead-induced Hepatotoxicity. Toxicol Int 17(1): 12-17. doi:10.4103/0971-6580.68343. PubMed: 21042467. - DOI - PMC - PubMed
    1. Saha S, Ghosh S (. April 2012) Tinospora cordifolia: One plant, many roles. Anc Sci Life. April; 31(4): 151-159. doi:10.4103/0257-7941.107344. PubMed: 23661861. - DOI - PMC - PubMed

Publication types

MeSH terms