. 2013 Oct 24;7(10):e2509.
doi: 10.1371/journal.pntd.0002509. eCollection 2013.

Infection with Usutu virus induces an autophagic response in mammalian cells

Affiliations

Infection with Usutu virus induces an autophagic response in mammalian cells

Ana-Belén Blázquez et al. PLoS Negl Trop Dis. .

Abstract

Usutu virus (USUV) is an African mosquito-borne flavivirus closely related to West Nile virus and Japanese encephalitis virus, which host range includes mainly mosquitoes and birds, although infections in humans have been also documented, thus warning about USUV as a potential health threat. Circulation of USUV in Africa was documented more than 50 years ago, but it was not until the last decade that it emerged in Europe causing episodes of avian mortality and some human severe cases. Since autophagy is a cellular pathway that can play important roles on different aspects of viral infections and pathogenesis, the possible implication of this pathway in USUV infection has been examined using Vero cells and two viral strains of different origin. USUV infection induced the unfolded protein response, revealed by the splicing of Xbp-1 mRNA. Infection with USUV also stimulated the autophagic process, which was demonstrated by an increase in the cytoplasmic aggregation of microtubule-associated protein 1 light chain 3 (LC3), a marker of autophagosome formation. In addition to this, an increase in the lipidated form of LC3, that is associated with autophagosome formation, was noticed following infection. Pharmacological modulation of the autophagic pathway with the inductor of autophagy rapamycin resulted in an increase in virus yield. On the other hand, treatment with 3-methyladenine or wortmannin, two distinct inhibitors of phosphatidylinositol 3-kinases involved in autophagy, resulted in a decrease in virus yield. These results indicate that USUV virus infection upregulates the cellular autophagic pathway and that drugs that target this pathway can modulate the infection of this virus, thus identifying a potential druggable pathway in USUV-infection.


Conflict of interest statement

The authors have declared that no competing interests exist.

Figures

Figure 1
Figure 1. Ultrastructural analysis of USUV-infected cells reveals multiple organelles compatible with an autophagic response.
Representative images of Vero cells infected with USUV SAAR 1776 (MOI of 5 PFU/cell) fixed and processed for transmission electron microscopy at 24 h p.i. (A) Electron dense virions located inside endoplasmic reticulum. (B) Vesicle packets (VP). (C) Endoplasmic reticulum-like structure wrapping around cytoplasmic material. Note the presence of VPs associated to the membranes. (D) Cytoplasmic portion showing a double membrane autophagosome-like vacuole (arrowheads) and a double membrane phagophore-like structure engulfing a cytoplasmic portion (arrows). Note also the presence of multi-lamellar structures. (E) Accumulation of multi-lamellar structures. (F) Double membrane vesicle (arrowheads) in association with a multi-lamellar structure. Nu denotes the cell nucleus. Scale bars: 100 µm.
Figure 2
Figure 2. Analysis of LC3 modification following infection by USUV.
(A) Changes in LC3 levels induced by pharmacological modulation of autophagy. Vero cells were treated with either 3-MA or rapamycin for 24 h. Cells were lysed and LC3 was detected by western blotting using specific antibodies. Membrane was reincubated with an anti-β-actin antibody as a control for protein loading. (B) Quantification of LC3 species (LC3-I and LC3-II) by densitometry of western blots performed as in (A). Data were normalized across the experiments relative to control cells. (C) Cells infected or not with USUV SAAR 1776 (MOI of 0.5 PFU/cell) were lysed at different times p.i. and subjected to western blot analysis using an antibody against LC3 to detect non-lipidated LC3 (LC3-I) and LC3 conjugated to phosphatidylethanolamine (LC3-II). (D) Similar analysis to that performed in (C) was carried using a PVDF membrane instead of the nitrocellulose membrane used in (C). (E) Quantification of LC3 species (LC3-I and LC3-II) by densitometry of western blots of cells infected in (D). Data were normalized across the experiments relative to mock-infected cells. (F) Analysis of p62/SQSTM1 levels on cells infected with USUV SAAR 1776. The levels of p62/SQSTM1 were determined by western blot on Vero cells infected as in (B). LC3 and β-actin are also shown. Statistically significant differences are denoted by one asterisk (*) for P<0.05.
Figure 3
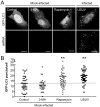
Figure 3. Induction of LC3 aggregation on cells infected with USUV.
(A) Visualization of autophagosome formation by LC3 aggregation in cells infected with USUV. Vero cells were transfected with a plasmid encoding GFP-LC3 and 24 h post-transfection were infected with USUV SAAR 1776 (MOI of 5 PFU/cell), or treated with 3-MA or rapamycin as controls. Cells were fixed and processed for immunofluorescence using a monoclonal antibody against dsRNA and secondary antibodies AF-594 labelled 24 h p.i. Scale bars: 10 µm. (B) Quantification of the number of LC3 aggregates per cell. The number of fluorescent aggregates on the cytoplasm of cells treated as in (A) was determined. Each point in the graph represents a different cell. Solid lines represent the mean number of GFP puncta per condition. Dashed line indicates the mean number of GFP puncta aggregates found in control cells. Statistically significant differences between each condition and control cells are denoted by two asterisks (**) for P<0.005.
Figure 4
Figure 4. Replication of USUV does not take place on autophagosomes.
(A) Representative confocal image of Vero cells transfected with GFP-LC3 plasmid and infected with USUV SAAR 1776 (MOI of 5 PFU/cell) 24 h post-transfection. Cells were fixed and processed for immunofluorescence 24 h post-infection using a monoclonal antibody against dsRNA and secondary antibodies AF-594 labelled. GFP-LC3 is shown green and dsRNA in red. (B) Cells transfected and infected as in (A) were stained with a polyclonal serum from a mouse experimentally infected with USUV to detect viral proteins. GFP-LC3 is shown in green and USUV proteins in red. (C) Cells infected as in (A) were immunostained using rabbit antibody against calnexin and a monoclonal antibody against dsRNA. Calnexin is shown in green and dsRNA in red. (D) Cells infected as in (A) were immunostained using a rabbit antibody against calnexin and the polyclonal mouse serum against USUV. Calnexin is shown in green and USUV proteins in red. Scale bars: 10 µm.
Figure 5
Figure 5. Accumulation of acidified autophagosomal structures in USUV-infected cells.
(A) Vero cells were transfected with mCherry-GFP-LC3 plasmid and treated with rapamycin, NH4Cl or infected with USUV SAAR 1776 (MOI of 5 PFU/cell) 24 h post-transfection. Cells were fixed and processed for immunofluorescence (24 h p.i. or after treatment with rapamycin or NH4Cl) using monoclonal antibody to detect dsRNA and appropriated Alexa Fuor-647 secondary antibodies. Colocalization between GFP and mCherry denotes autophagosomal structures that have not already fused with a lysosomal compartment (phagophores or autophagosomes) whereas mCherry signal without GFP signal denotes autophagosomal acidified organelle that have fused with lysosomes (amphisomes or autolysosomes). GFP, in green; mCherry, in red; dsRNA, in blue. Scale bars: 10 µm. (B) Quantification of the number of fluorescent puncta exhibiting green (GFP) or red (mCherry) fluorescence in cells transfected with mCherry-GFP-LC3 plasmid and treated or infected as in (A). Statistically significant differences between the number of red and green puncta displayed by the cells are denoted by one asterisk (*) for P<0.05 or two asterisks (**) for P<0.005. (C) Quantification of the number of fluorescent puncta displaying only mCherry fluorescence (acidified autophagosomal structures) of cells transfected with mCherry-GFP-LC3 plasmid and treated or infected as in (A). Statistically significant differences between each condition and control cells are denoted by one asterisk (*) for P<0.05 or two asterisks (**) for P<0.005.
Figure 6
Figure 6. USUV-infection activates the unfolded protein response.
(A) RNA was extracted from Vero cells infected with USUV SAAR 1776 (MOI of 0.5 PFU/cell) at different time p.i. and the presence of unspliced or spliced Xbp-1 mRNA was determined by RT-PCR. Cells treated with tunicamycin are included as a positive control of the activation of unfolded protein response. GAPDH mRNA was also amplified by RT-PCR as a control. (B) Quantification of the intensity of the band corresponding to amplified spliced Xbp-1 in cells treated as in (A) normalized by the intensity of amplified GAPDH.
Figure 7
Figure 7. Effects of pharmacological modulation of autophagy on USUV infection.
(A) Analysis of cellular viability upon treatment with 3-MA, wortmannin or rapamycin. Vero cells were treated with the drugs for 24 h and the viability was estimated by determination of cellular ATP levels by a luminescence assay. (B) Effect of pharmacological modulation of autophagy on USUV production. Cells infected with USUV SAAR 1776 (MOI of 0.5 PFU/cell) were treated with 3-MA, wortmannin or rapamycin and the virus yield were determined by plaque assay at 24 h p.i. Statistically significant differences between each condition and control cells are denoted by one asterisk (*) for P<0.05 or two asterisks (**) for P<0.005.
Figure 8
Figure 8. Autophagic features induced by the infection of a recent European isolate of USUV.
(A) Analysis of LC3 modification following infection with USUV Vienna 2001. Vero cells infected or not with USUV Vienna 2001 (MOI of 0.5 PFU/cell) were lysed at different times p.i. and subjected to western blot analysis using a PVDF membrane and an antibody against LC3 to detect non-lipidated LC3 (LC3-I) and LC3 conjugated to phosphatidylethanolamine (LC3-II). Membrane was reincubated with an anti-β-actin antibody as a control for protein loading. (B) Quantification of LC3 species by densitometry of western blots performed as in (A) normalized across the experiments. (C) Visualization of autophagosome formation by LC3 aggregation in cells infected with USUV Vienna 2001. Vero cells were transfected with a plasmid encoding GFP-LC3 and 24 h post-transfection were infected with USUV Vienna 2001 (MOI of 5 PFU/cell). Cells were fixed and processed for immunofluorescence using a monoclonal antibody against dsRNA and secondary antibody AF-594 labelled 24 h p.i. (D) Quantification of the number of LC3 aggregates per cell. The number of fluorescent aggregates on the cytoplasm of cells infected as in (C) was determined. Each point in the graph represents a different cell. Solid lines represent the mean number of GFP puncta per condition. (E) Cells infected as in (B) were immunostained using rabbit antibody against calnexin and a monoclonal antibody against dsRNA. Calnexin is shown in green and dsRNA in red. (F) Cells infected as in (A) were immunostained using rabbit antibody against calnexin and the polyclonal mouse serum against USUV. Calnexin is shown in green and USUV proteins in red. (G) Effect of pharmacological modulation of autophagy on USUV Vienna 2001 production. Cells infected with USUV Vienna 2001 or SAAR 1776 (MOI of 0.5 PFU/cell) were treated with 3-MA, wortmannin or rapamycin and the virus yield were determined by plaque assay at 24 h p.i. Statistically significant differences between each condition and control cells are denoted by one asterisk (*) for P<0.05 or two asterisks (**) for P<0.005. Scale bars: 10 µm.

References

    1. Kilpatrick AM (2011) Globalization, land use, and the invasion of West Nile virus. Science 334: 323–327. - PMC - PubMed
    1. Weaver SC, Reisen WK (2010) Present and future arboviral threats. Antiviral Res 85: 328–345. - PMC - PubMed
    1. Brault AC (2009) Changing patterns of West Nile virus transmission: altered vector competence and host susceptibility. Vet Res 40: 43. - PMC - PubMed
    1. Vazquez A, Jimenez-Clavero M, Franco L, Donoso-Mantke O, Sambri V, et al. (2011) Usutu virus: potential risk of human disease in Europe. Euro Surveill 16: pii = 19935. - PubMed
    1. Nikolay B, Diallo M, Boye CS, Sall AA (2011) Usutu virus in Africa. Vector Borne Zoonotic Dis 11: 1417–1423. - PubMed

Publication types