. 2013 Nov 9:14:320.
doi: 10.1186/1471-2105-14-320.

Design of RNA splicing analysis null models for post hoc filtering of Drosophila head RNA-Seq data with the splicing analysis kit (Spanki)

Affiliations

Design of RNA splicing analysis null models for post hoc filtering of Drosophila head RNA-Seq data with the splicing analysis kit (Spanki)

David Sturgill et al. BMC Bioinformatics. .

Abstract

Background: The production of multiple transcript isoforms from one gene is a major source of transcriptome complexity. RNA-Seq experiments, in which transcripts are converted to cDNA and sequenced, allow the resolution and quantification of alternative transcript isoforms. However, methods to analyze splicing are underdeveloped and errors resulting in incorrect splicing calls occur in every experiment.

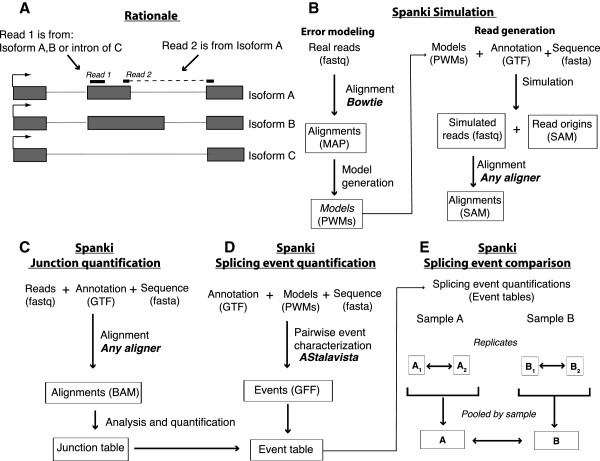
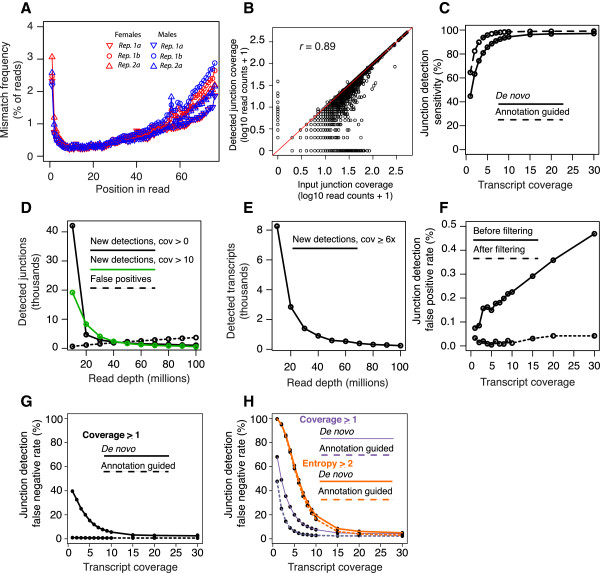
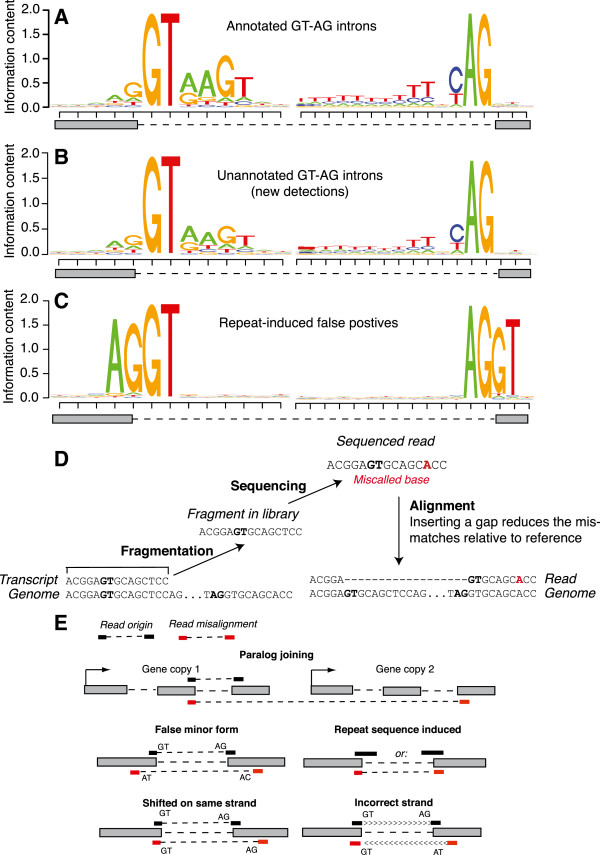
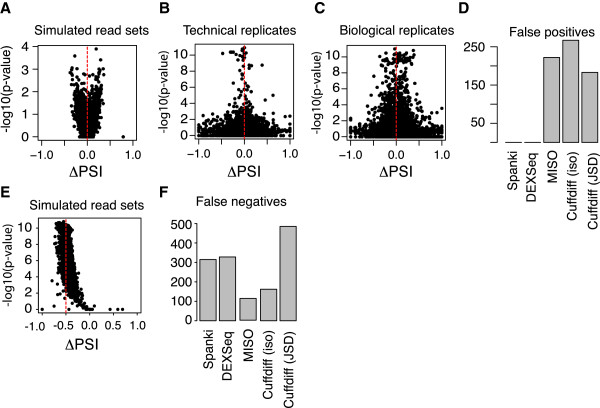
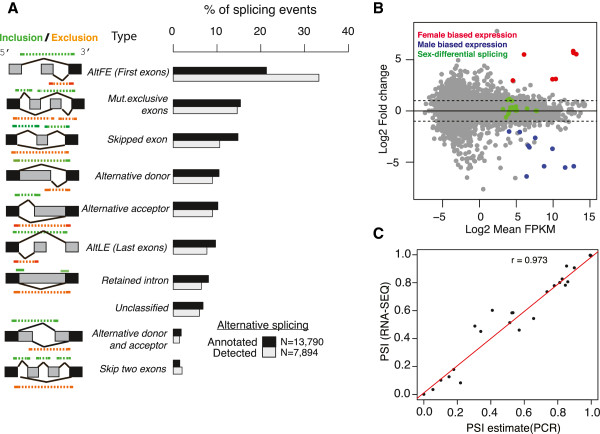
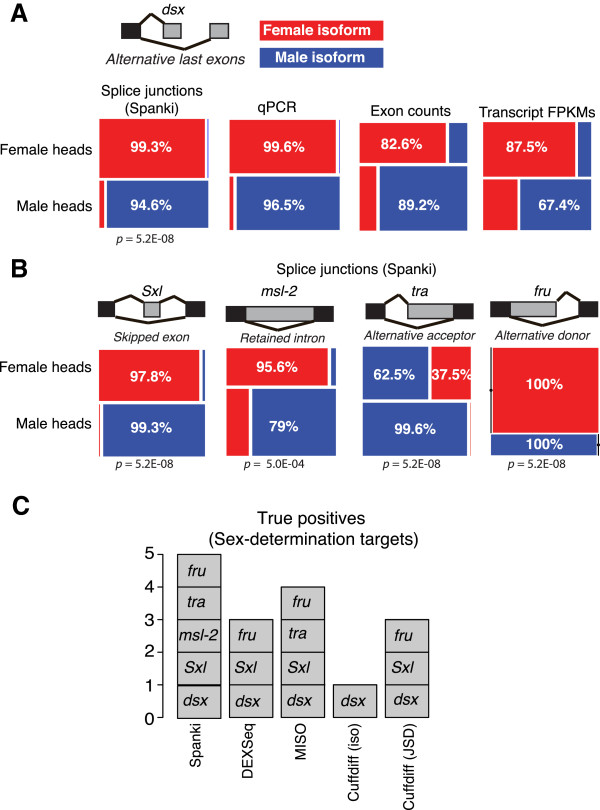
Results: We used RNA-Seq data to develop sequencing and aligner error models. By applying these error models to known input from simulations, we found that errors result from false alignment to minor splice motifs and antisense stands, shifted junction positions, paralog joining, and repeat induced gaps. By using a series of quantitative and qualitative filters, we eliminated diagnosed errors in the simulation, and applied this to RNA-Seq data from Drosophila melanogaster heads. We used high-confidence junction detections to specifically interrogate local splicing differences between transcripts. This method out-performed commonly used RNA-seq methods to identify known alternative splicing events in the Drosophila sex determination pathway. We describe a flexible software package to perform these tasks called Splicing Analysis Kit (Spanki), available at http://www.cbcb.umd.edu/software/spanki.

Conclusions: Splice-junction centric analysis of RNA-Seq data provides advantages in specificity for detection of alternative splicing. Our software provides tools to better understand error profiles in RNA-Seq data and improve inference from this new technology. The splice-junction centric approach that this software enables will provide more accurate estimates of differentially regulated splicing than current tools.


Figures

Figure 1
Figure 1
Rationale and overview of analysis approach. (A) Cartoon of a hypothetical locus encoding alternatively spliced transcripts, illustrating how junction spanning reads map unambiguously to specific introns. Read 1 could have originated from the 2nd exon of isoform A or B, or the intron of isoform C; while read 2 could only have originated from isoform A and the indicated splice junction. (B-E) Flowcharts of analysis steps performed in Spanki. Input data listed at the top, format in parentheses, and calls to external programs indicated (bold). (B) Flowchart of simulation methods. A two step process begins with modeling error profiles based on a permissive Bowtie [19] alignment. These error models are used by the simulator to generate reads. (C-E) Flowcharts of quantification and comparison methods. The first step is junction quantification (C), where alignments are performed, junction alignments are curated, and junction coverages are calculated. Splicing event quantification (D), where a set of transcript models (from annotation or computed using a program such as Cufflinks [11]), are used to characterize pairwise splicing differences (“splicing events”). These events are merged with junction coverage data to quantify the mutually exclusive paths defined for each event. Splicing event comparison (E) uses these tabulated event-level quantifications to compare between replicates, and between pooled results for each sample, by Fisher’s Exact Test on inclusion and exclusion junction counts.
Figure 2
Figure 2
Simulation results and junction detection. (A) Actual mismatch frequency by read position. Replicates (technical and biological) of female (red) and male samples (blue) are indicated. (B) Accuracy of annotated junction detection. Recovered junction coverage (y-axis) compared to actual coverage (x-axis) in simulated input. Read counts (+1) in log10 scale. (C) Sensitivity of junction detection (1 – false negative rate). Receiver operator characteristic (ROC) curve of splice junction detection displays sensitivity as it relates to sequencing depth. Results represent TopHat mapping with annotation (dashed line), and without annotation (solid line). (D) Junction detection in subsamples of real data in read pools of increasing sequencing depth (10–100 million reads in increments of 10 million). Junctions detected with at least one read (black line), or with ≥10 reads (green line) are indicated. For each pool, the additional junctions detected relative to the previous pool are indicated. Total cumulative false positive junction detections in each pool (dashed line). (E) Transcript coverage in subsamples of real data. Annotated transcripts detected with at least 6x coverage (black line) in each subsampled pool of real data. (F) Junction detection false positive rate in simulated data pre- (solid line) and post-filtering (dashed line). False positive rate is in percent of all annotated junctions with simulated reads, and is not cumulative. (G) False negative rate of junction detection due to alignment failure (i.e., not due to sampling), when at least one junction spanning read is generated from simulated transcripts. (H) False negative rate of junction detection due to sampling. Rates are for detecting at least one junction spanning read (coverage ≥ 1, purple lines), or for detecting an entropy score ≥ 2 (orange lines).
Figure 3
Figure 3
Sequence characteristics of false positive junctions. Sequence logos of exon and intron sequence bordering splice junctions in (A) annotated GT-AG introns, (B) unannotated GT-AG introns detected that pass filtering, and (C) repeat induced false positives. (D) Cartoon illustrating how false positives arise from repetitive sequence and sequencing error. A transcribed fragment from a region of repetitive sequence is incorporated into a library. A base calling error (in red) produces a read with an “A” instead of a “T” at the indicated position. This incorrect base call induces an incorrect gapped alignment that minimizes sequence mismatches. (E) Illustration of each false positive error type (Table  2).
Figure 4
Figure 4
Variation in Percent Spliced-In (PSI) and error rates. Volcano plots where ΔPSI is plotted against the –log10 p-value of the Fisher’s Exact Test, to assay variation due to sampling and sequencing error in simulations (A), technical RNA-Seq replicates (B), and biological replicates (C). (A) Plot comparing two simulated read sets of equal reads per kilobase (300 Reads Per Kilobase). Since transcript abundances are equal, expected ΔPSI is zero. (B) Variation in ΔPSI between replicate RNA-Seq runs of the same libraries. (C) Variation in ΔPSI between independent biological samples, each with a distinct RNA-Seq library. Results within each sex were similar, results for female samples shown. (D) False positive differential splicing calls in a null dataset. Cufflinks results are shown for both splicing analysis (Jensen-Shannon Divergence, JSD), and isoform abundance comparison. MISO results shown are based on isoform-centric analysis. (E) Volcano plot of ΔPSI calculated by Spanki for false negative analysis, comparing simulated datasets with PSI = 0.25 and PSI = 0.75 respectively, for 1644 events (expected ΔPSI = -0.50, red line). (F) Counts of false negatives for differential splicing calls in simulated data with an input ΔPSI = -0.50.
Figure 5
Figure 5
Splicing event characterization in Drosophila heads. (A) Pairwise splicing events defined for all transcript models in Flybase 5.39 annotation (black bars), and the subset of those detected as alternatively spliced in female and male Drosophila heads by Spanki (grey bars). Black bars indicate splicing event classes as a percent of all defined pairwise events. Grey bars indicate splicing events detected as a percent of all detected events. Cartoons of each event type are in the leftmost column, with the “inclusion” form indicated in green, and the “exclusion” form indicated in orange. A description of each type is adjacent to each cartoon. The “Unclassified” types includes diverse complex type with no concise verbal description. (B) Ratio vs average abundance scatterplots of gene expression in female and male heads. Genes with significant sex-biased gene-level expression (FDR adjusted p < 0.05, Cuffdiff) in females (red), or males (blue). Remaining detected expression events are in grey. Transcripts showing sex-biased splicing have been projected onto the gene-level expression data (green). (C) Scatter plot of percent spliced in (PSI) by RNA-Seq vs qPCR for the inclusion or exclusion form for each event assayed (the PCR primer pairs differ for detecting exon inclusion or exclusion but approximates PSI). Inset is Pearson’s r coefficient.
Figure 6
Figure 6
Resolution of splicing differences in the sex determination pathway. Detection and visualization of sex-differential splicing in sex determination pathway components by different methods. (A) Analysis of the regulated alternative last exons splicing event in dsx, showing the splicing difference between the female isoform (top, red) and male isoform (bottom, blue). Mosaic plots display female isoform (red) and the male isoform (blue) abundances in each sex for: splice junctions counts, qPCR, counts of reads within exons, and full length isoform abundance estimates (FPKM). (B) Splicing analysis for other components of the sex determination pathway, along with sex-differential splicing results obtained: Sxl, skipped exon; msl-2, retained intron, tra, alternative acceptor, and fru, alternative donor. Significance measures from Spanki (Benjamini-Hochberg adjusted p-value) are shown beneath each mosaic plot. (C) Performance of other RNA-Seq analysis tools in detecting sex determination pathway components. DEXSeq [12], which relies only on exon-level counts, detected significant differences in fru, Sxl, and dsx, but not in msl-2 or tra. Similarly, a Bayesian analysis with MISO [13] failed to detect differential splicing of msl-2 transcripts. For Cuffdiff [11], we examined results for the splicing difference test (Jensen-Shannon Divergence metric), and also for isoform abundance differences.

Similar articles

Cited by

References

    1. Black DL. Mechanisms of alternative pre-messenger RNA splicing. Annu Rev Biochem. 2003;72:291–336. doi: 10.1146/annurev.biochem.72.121801.161720. - DOI - PubMed
    1. Oshlack A, Robinson MD, Young MD. From RNA-seq reads to differential expression results. Genome Biol. 2010;11:220. doi: 10.1186/gb-2010-11-12-220. - DOI - PMC - PubMed
    1. Martin JA, Wang Z. Next-generation transcriptome assembly. Nat Rev Genet. 2011;12:671–682. doi: 10.1038/nrg3068. - DOI - PubMed
    1. Jiang L, Schlesinger F, Davis CA, Zhang Y, Li R, Salit M, Gingeras TR, Oliver B. Synthetic spike-in standards for RNA-seq experiments. Genome Res. 2011;21(9):1543–1551. doi: 10.1101/gr.121095.111. - DOI - PMC - PubMed
    1. Roberts A, Trapnell C, Donaghey J, Rinn JL, Pachter L. Improving RNA-Seq expression estimates by correcting for fragment bias. Genome Biol. 2011;12:R22. doi: 10.1186/gb-2011-12-3-r22. - DOI - PMC - PubMed

Publication types