. 2013 Nov 7;155(4):858-68.
doi: 10.1016/j.cell.2013.10.015.

The landscape of microsatellite instability in colorectal and endometrial cancer genomes

Affiliations

The landscape of microsatellite instability in colorectal and endometrial cancer genomes

Tae-Min Kim et al. Cell. .

Abstract

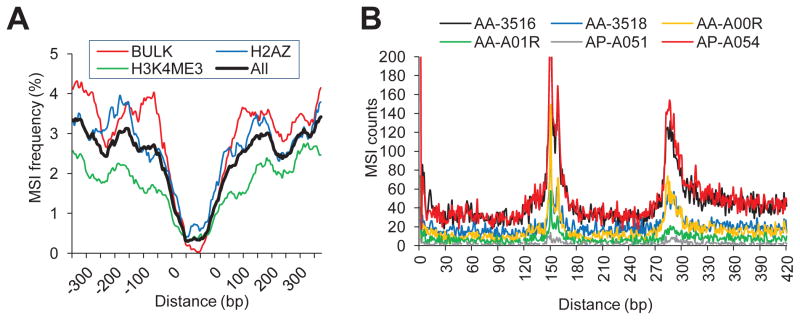
Microsatellites-simple tandem repeats present at millions of sites in the human genome-can shorten or lengthen due to a defect in DNA mismatch repair. We present here a comprehensive genome-wide analysis of the prevalence, mutational spectrum, and functional consequences of microsatellite instability (MSI) in cancer genomes. We analyzed MSI in 277 colorectal and endometrial cancer genomes (including 57 microsatellite-unstable ones) using exome and whole-genome sequencing data. Recurrent MSI events in coding sequences showed tumor type specificity, elevated frameshift-to-inframe ratios, and lower transcript levels than wild-type alleles. Moreover, genome-wide analysis revealed differences in the distribution of MSI versus point mutations, including overrepresentation of MSI in euchromatic and intronic regions compared to heterochromatic and intergenic regions, respectively, and depletion of MSI at nucleosome-occupied sequences. Our results provide a panoramic view of MSI in cancer genomes, highlighting their tumor type specificity, impact on gene expression, and the role of chromatin organization.


Figures

Figure 1
Figure 1. The mutational spectrum of MSI events and MMR genes in CRC and EC genomes
(A) The number of MS loci with significant tumor genome-specific DNA slippage events is shown for each of CRC genomes (141 cases with data on MLH1 promoter hypermethylation are displayed out of 147; also see Figure S1), along with the SNV mutation rate. The samples are sorted in decreasing order of MSI events. The MSI status based on the Bethesda criteria (25 MSI-H, 23 MSI-L and 93 MSS cases) are noted. The functional status of selected MMR genes and POLE are classified into MSI events (frameshift and in-frame), nonsilent point mutations (missense or nonsense) and transcriptional silencing of MLH1 by hypermethylation. See main Text for the sample with an arrow. (B) Similar to (A) for EC genomes (115 cases with MLH1 promoter hypermethylation data are displayed out of 130). (C) (Left) For the 27 MSI-H CRC genomes, the numbers of MSI events in the four different categories of genomic regions (coding, noncoding and 5′/3′ UTR) are shown in the upper panel. In the lower panel, the number of MSI events was normalized by the total number of MS in the exome reference set for each category. (Right) Same analysis for MSI-H EC genomes (three samples with <10 MSI were removed). See also Figure S1 and Table S1, S2 and S3.
Figure 2
Figure 2. The distribution of allelic shift in MSI events and the properties of recurrent coding MSI
(A) For MSI events occurring at the mononucleotide MS (y-axis; each row) in the CRC genomes, the deviations in the allele lengths (−10bp to +5bp) compared to the germline counterparts are shown as normalized allelic fractions in a heatmap (the values in each row add up to 1), clustered by their similarity. The locations of the corresponding MS (coding, noncoding and 5′/3′ UTR) are shown on the right. (B) MSI events are classified into low- and high-allelic shift (MSI-LAS and MSI-HAS) cases. The graph shows the different frequencies of the two MSI types for the four categories in CRC genomes. (C) MSI events in the coding sequences (CDS) and non-CDS regions are further classified into frameshift and in-frame mutations for CDS (non-triplet and triplet for non-CDS). The frameshift-to-inframe ratio increases with respect to the level of recurrence (% of MS-unstable genomes harboring the mutation; the width of each bar is proportional to the number of MSI) for CDS MSI events. (D–F) Similar to the above for EC genomes. (G) The distribution of A10 homopolymer length on TGFBR2 locus is shown for one CRC genome with positive MSI calls as measured by Sanger- (upper) and exome-sequencing data (below). (H) Similar to AA-2676 as an MSI-negative example. (I–J) The MSI events per sample are compared to those made after local realignment by GATK or by global realignment by Novoalign for 27 MSI-H CRC (I) and 30 EC genomes (J). Overlap and specific calls are distinguished to those overlapped with BWA-based calls or not, respectively. See also Figure S2.
Figure 3
Figure 3. The genes harboring frameshift MSI in CRC and EC genomes and tumor type specificity
A scatter plot shows the distribution of genes with respect to their frequency of frameshift MSI in CRC and EC genomes. The 27 genes with frameshift MSI in >30% of CRC or in >15% of EC MSI-H genomes are noted. The color gradient indicates the extent of tumor type-specificity (red and blue for CRC- and EC-specificity, respectively). The size of the circles indicates the number of genes with the corresponding MSI frequencies. See also Figure S3 and Table S4.
Figure 4
Figure 4. Association between MSI and changes in expression level
(A) The MSI events in CRC genomes accompanied by a significant deviation in expression levels between the wildtype versus mutant alleles are classified into ‘MSI-overexpressed’ and ‘MSI-underexpressed’ in each of four regions. The asterisk indicates significant differential counts (binomial test; P < 0.05) for frameshift coding (P = 0.0009), in-frame coding (P = 0.0462) and 3′ UTR MSI (P = 0.0002). (B) Similarly for EC genomes with significant differential counts for 5′ UTR (P = 0.0110) and frameshift coding MSI (P = 0.0027). (C) The 37 MS loci showing MSI-overexpression or MSI-underexpression in two or more CRC genomes are shown (x-axis; left), along with 14 such MS loci from EC genomes (right). The associated gene symbols and the location of the MS (‘C’, ‘N’, ‘5’, and ‘3’ for coding, noncoding, 5′ UTR, and 3′ UTR MSI) are shown. For each MS locus, the number of samples showing differential expression (over- or under-expressed) is plotted (y-axis). (D) The log2 ratio of the expression levels is shown (y-axis). A higher ratio indicates that the gene showed higher expression in the genomes with the corresponding MSI than those without. An asterisk indicates significant (T-test, P < 0.05) difference in the expression level. See also Table S5.
Figure 5
Figure 5. Genome-wide landscape of MSI
(A) The number of MSI events genome-wide is shown for the 17 samples with whole-genome sequencing data. Six genomes (4 CRC and 2 EC genomes) with >60,000 MSI events are shaded grey and used for subsequent analyses. (B) The MSI events are classified into five categories based on their genomic location. (C) The number of MSI calls is normalized by the background MS abundance in their respective regions of the genome to obtain MSI frequency. See also Figure S4.
Figure 6
Figure 6. Correlation with epigenomic features
(A) The Pearson correlation between MSI frequency and SNV density (measured using 1Mb bins) is shown for four human cancer types. For the ‘Total’ category, SNV densities from the cancer types were combined. (B) The same correlation analysis was performed between the frequency of MSI and enrichment of various histone modifications. (C) MSI frequencies in the early-, intermediate- and late-replicating timing regions are shown. See also Figure S5.
Figure 7
Figure 7. Depletion of MSI around stable nucleosome positions
(A) MSI frequency around stable nucleosome positions is shown for one CRC genome (AA-3516; also see Figure S6). (B) The distribution of distances between adjacent MSI pairs indicates periodicity associated with the nucleosome size. See also Figure S6.

References

    1. Barski A, Cuddapah S, Cui K, Roh TY, Schones DE, Wang Z, Wei G, Chepelev I, Zhao K. High-resolution profiling of histone methylations in the human genome. Cell. 2007;129:823–837. - PubMed
    1. Bass AJ, Lawrence MS, Brace LE, Ramos AH, Drier Y, Cibulskis K, Sougnez C, Voet D, Saksena G, Sivachenko A, et al. Genomic sequencing of colorectal adenocarcinomas identifies a recurrent VTI1A-TCF7L2 fusion. Nat Genet. 2011;43:964–968. - PMC - PubMed
    1. Berger MF, Lawrence MS, Demichelis F, Drier Y, Cibulskis K, Sivachenko AY, Sboner A, Esgueva R, Pflueger D, Sougnez C, et al. The genomic complexity of primary human prostate cancer. Nature. 2011;470:214–220. - PMC - PubMed
    1. Boland CR, Goel A. Microsatellite instability in colorectal cancer. Gastroenterology. 2010;138:2073–2087. - PMC - PubMed
    1. Brough R, Bajrami I, Vatcheva R, Natrajan R, Reis-Filho JS, Lord CJ, Ashworth A. APRIN is a cell cycle specific BRCA2-interacting protein required for genome integrity and a predictor of outcome after chemotherapy in breast cancer. EMBO J. 2012;31:1160–1176. - PMC - PubMed

Publication types