
KSR2 mutations are associated with obesity, insulin resistance, and impaired cellular fuel oxidation

Laura R Pearce et al. Cell. .

Abstract

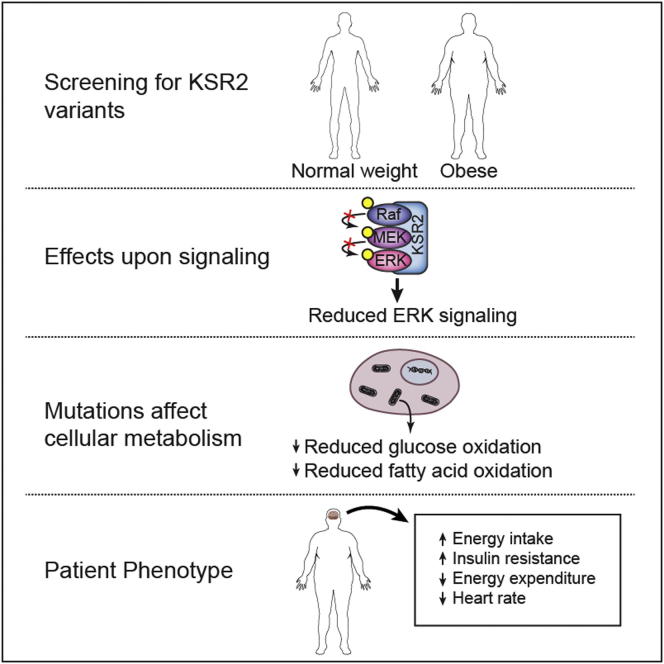
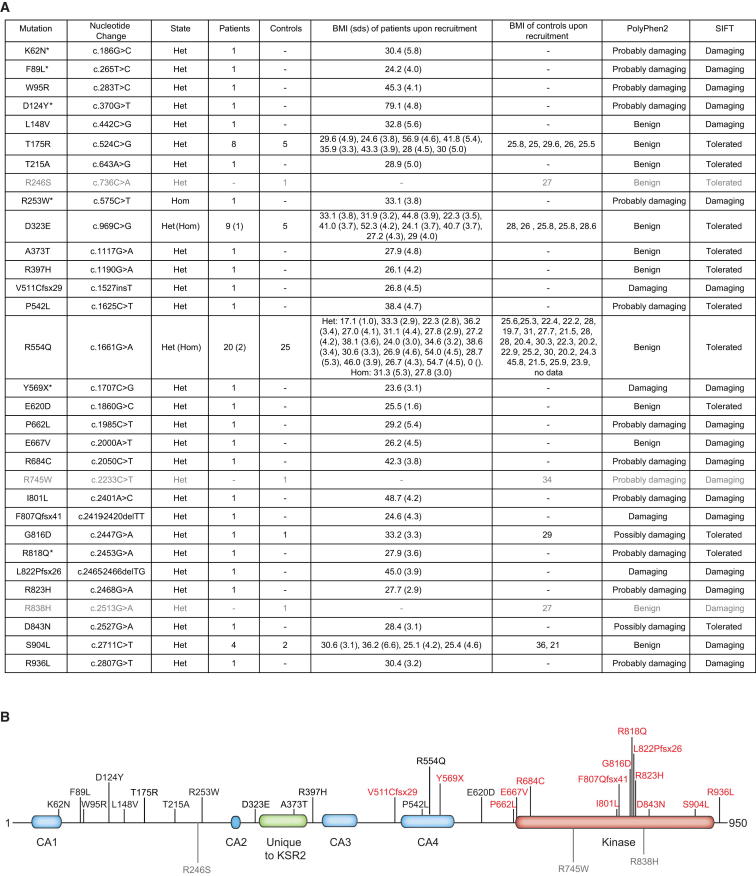
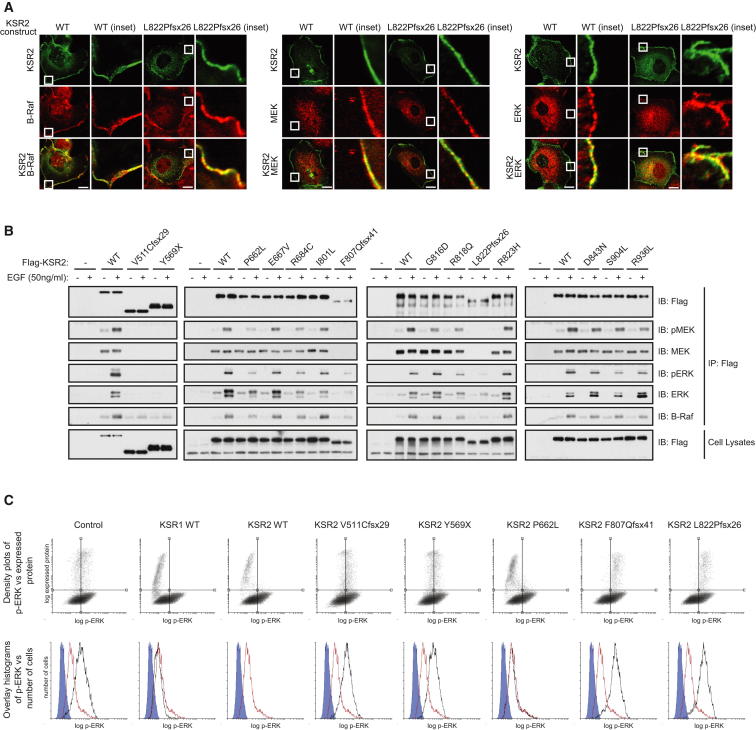
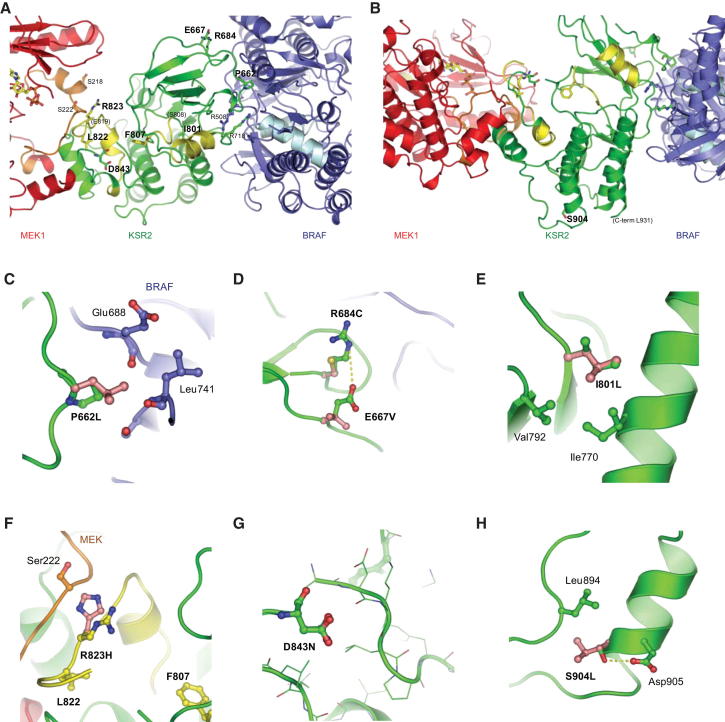
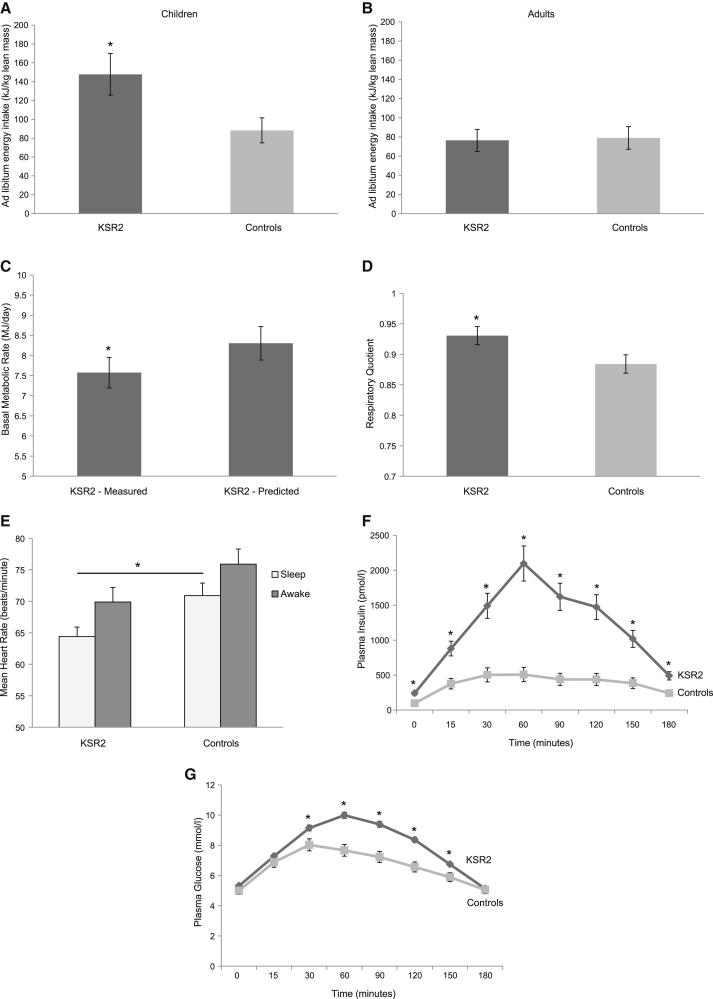
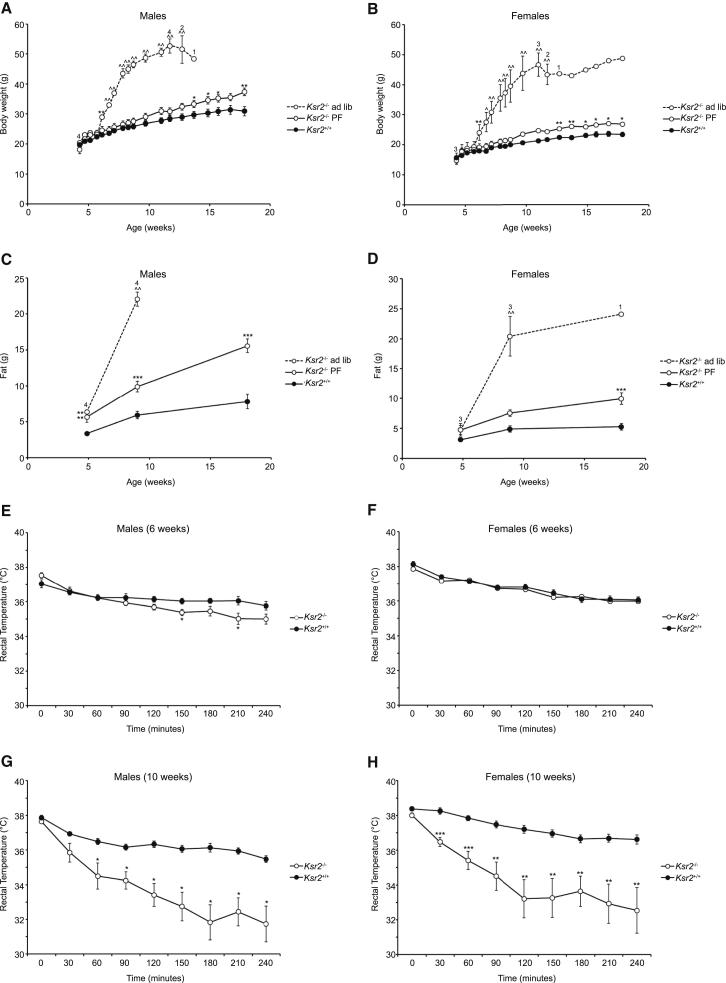
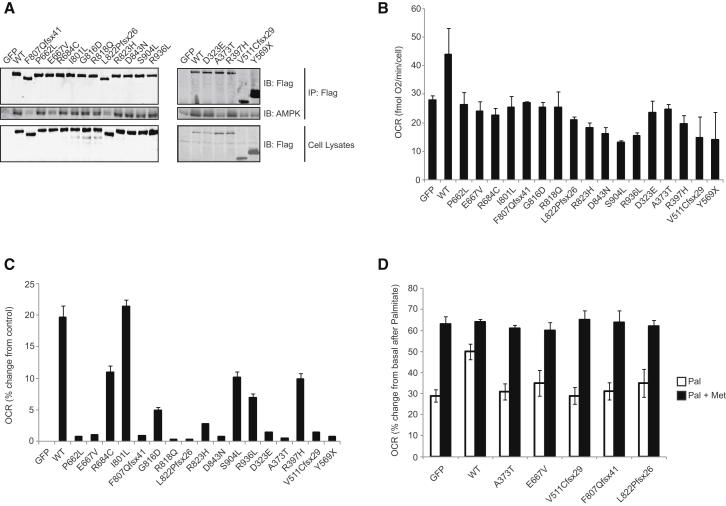
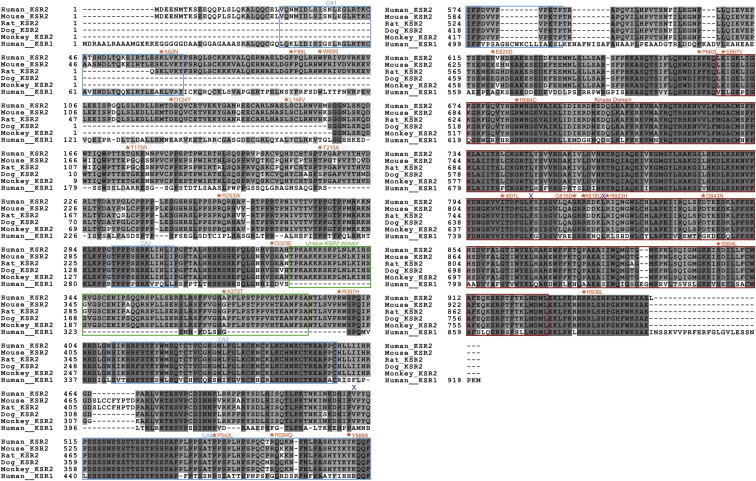
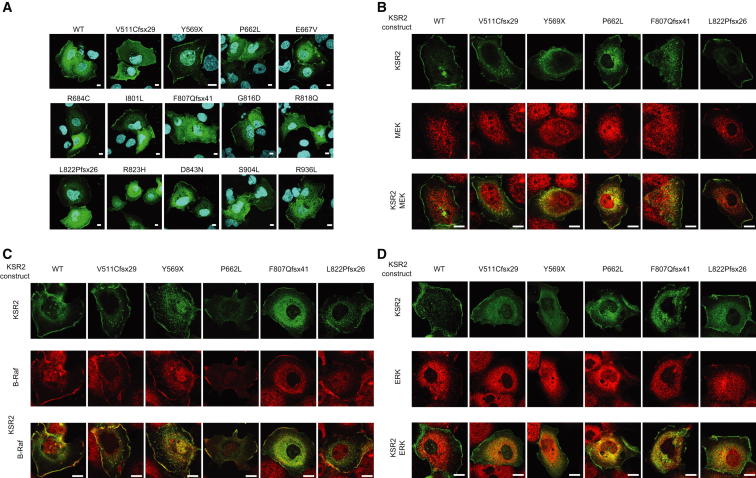
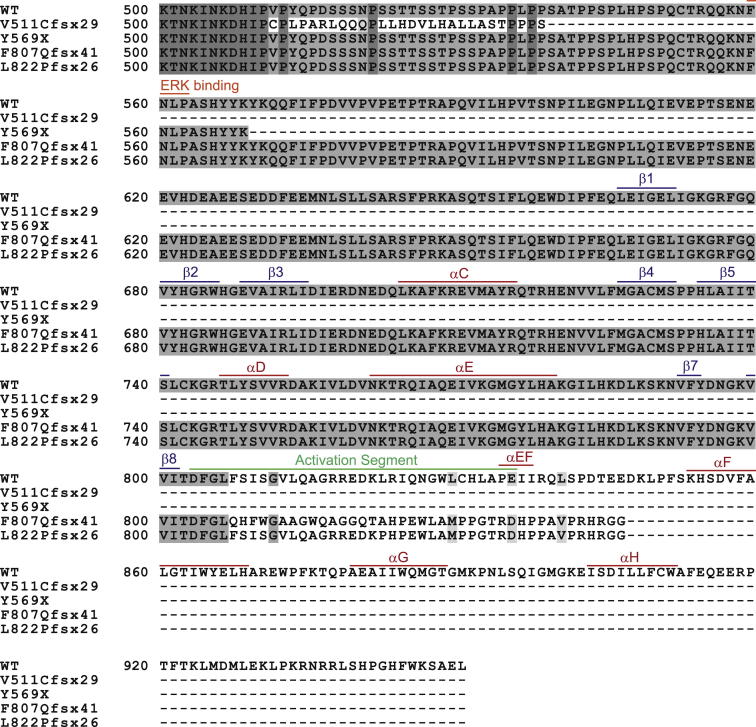
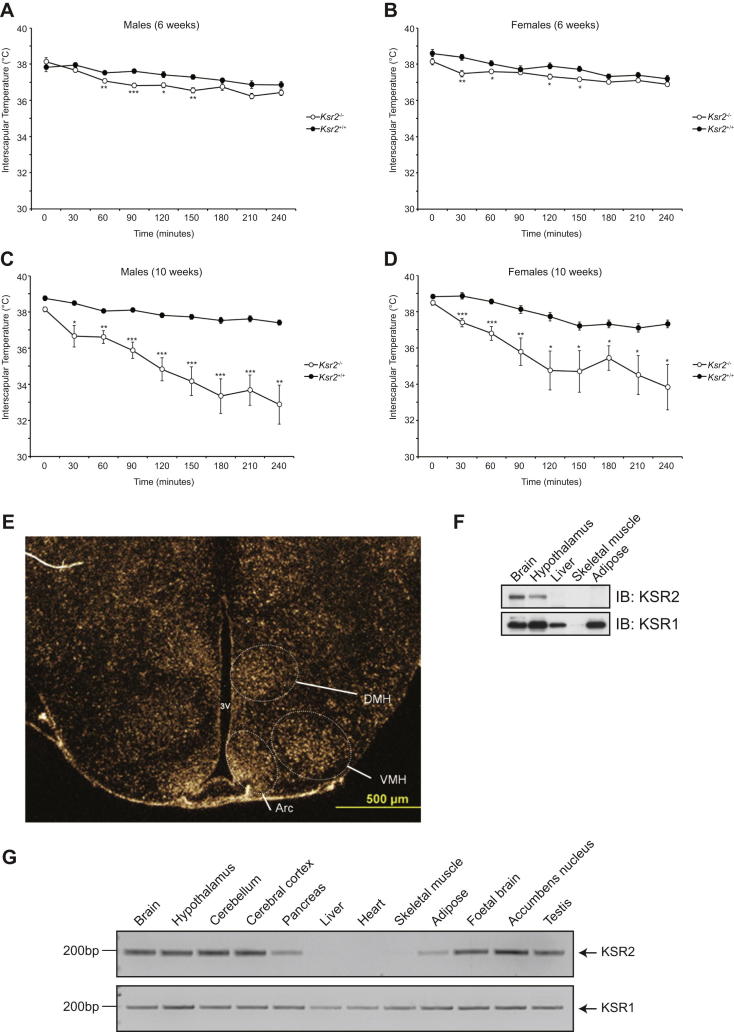
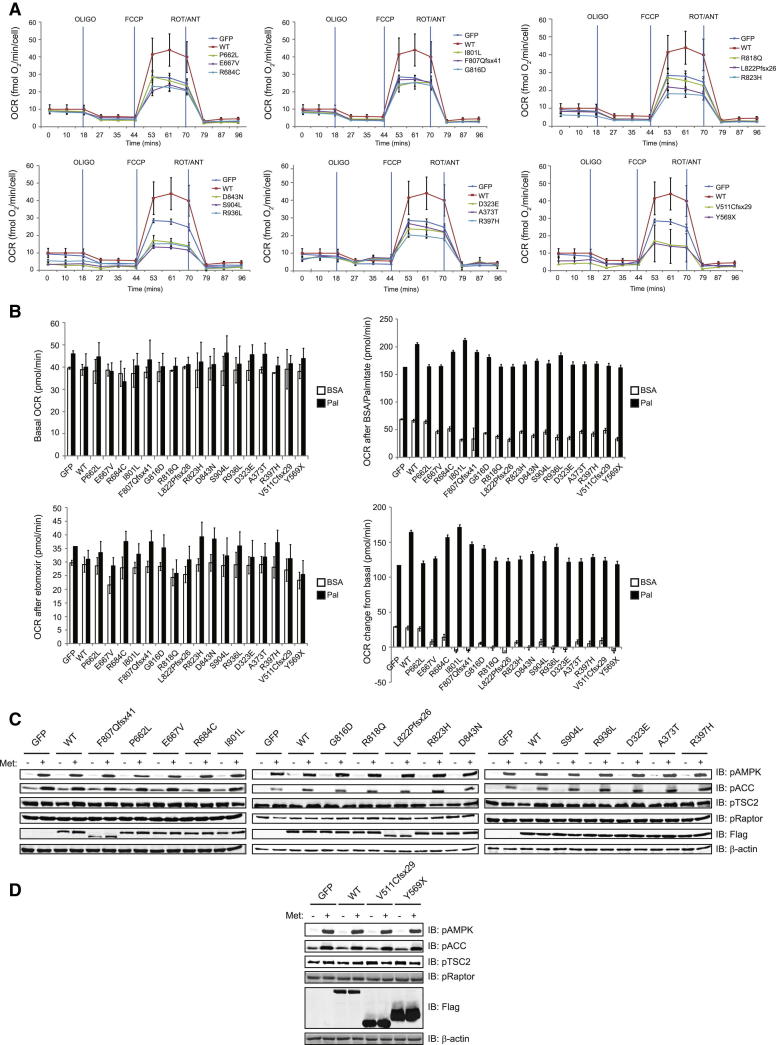
Kinase suppressor of Ras 2 (KSR2) is an intracellular scaffolding protein involved in multiple signaling pathways. Targeted deletion of Ksr2 leads to obesity in mice, suggesting a role in energy homeostasis. We explored the role of KSR2 in humans by sequencing 2,101 individuals with severe early-onset obesity and 1,536 controls. We identified multiple rare variants in KSR2 that disrupt signaling through the Raf-MEKERK pathway and impair cellular fatty acid oxidation and glucose oxidation in transfected cells; effects that can be ameliorated by the commonly prescribed antidiabetic drug, metformin. Mutation carriers exhibit hyperphagia in childhood, low heart rate, reduced basal metabolic rate and severe insulin resistance. These data establish KSR2 as an important regulator of energy intake, energy expenditure, and substrate utilization in humans. Modulation of KSR2-mediated effects may represent a novel therapeutic strategy for obesity and type 2 diabetes.


Figures

None
Graphical abstract
Figure 1
Figure 1
Identification of Multiple KSR2 Mutations in Severely Obese Individuals and Controls (A) Mutations in KSR2 identified in individuals with severe early-onset obesity and in controls (shown in gray). Mutations identified by whole-exome sequencing are marked with an asterisk; all others were identified by Sanger sequencing. Mutation numbering is based on Ensembl transcript ID ENST00000339824 and Protein ID ENSP00000339952; Het = heterozygous and Hom = homozygous. As BMI (kg/m2) varies with age and gender, the BMI and BMI SD scores (sds) are noted. The potential functional consequences of each mutation were assessed using Polyphen2 and SIFT. (B) Schematic representation of full-length KSR2 (Q6VAB6), indicating the location of each of the mutations identified in individuals with severe early-onset obesity and those found in controls (shown in gray). Domains conserved in KSR1 are indicated in blue (CA1-4) and the domain found only in KSR2 is shown in green; the kinase domain is indicated in red. The mutations found in severely obese individuals that were subjected to functional characterization are shown in red. See also Tables S1 and S2 and Figure S1.
Figure 2
Figure 2
Obesity-Associated KSR2 Mutations Disrupt Raf/MEK/ERK Signaling (A) Confocal microscopy of EGF-stimulated Cos7 cells showing the colocalization of transiently expressed KSR2 WT and the frameshift mutation, L822Pfsx26 (green), with endogenous B-Raf, MEK, and ERK (red) in the cytoplasm and plasma membrane (inset). Scale bars, 10 μm. (B) HEK293 cells transfected with the indicated KSR2 constructs were serum starved for 16 hrs prior to stimulation with 50 ng/ml EGF for 10 min. Lysates were subjected to immunoprecipitation with Flag-agarose and immunoblotted with the indicated antibodies. (C) Top: Flow cytometry density plots showing the effect of KSR overexpression on ERK phosphorylation. Bottom: Flow cytometry histograms gated on transfected cells, comparing the effect on ERK phosphorylation of overexpressing different KSR2 mutants (black) versus WT KSR2 (Red). A background control is shown in blue. See also Figure S2.
Figure 3
Figure 3
Structural Modeling of Mutations within the Kinase Domain of KSR2 (A and B) Structure of the MEK1-KSR2-BRAF ternary complex (Brennan et al., 2011) indicating the location of all the mutations studied. (C–H) Local environment and packing interactions of specific amino acid substitutions in KSR2. Disease-associated residues are shown in pink. See also Figure S3.
Figure 4
Figure 4
KSR2 Mutations Affect Energy Intake and Energy Expenditure in Humans Data are presented for individuals carrying rare variants in KSR2 and obese controls in whom KSR2 variants were excluded. Values are mean ± SEM; p < 0.05. (A and B) Ad libitum energy intake at an 18MJ test meal presented after an overnight fast to children with KSR2 mutations and normal weight children (A) and to adults with KSR2 mutations compared to obese controls (B); intake is expressed as kilojoules per kilogram of lean mass. (C) Measured and predicted basal metabolic rate (BMR) adjusted for kg fat free mass in adults with KSR2 mutations. (D) Respiratory quotient as measured by indirect calorimetry. (E) Heart rate (beats per minute) during sleep and in the awake state measured using a portable digital accelerometer. (F and G) Plasma insulin (pmol/l) and glucose (mmol/l) before and after a 75 g oral glucose load (given at time 0). See also Table S3.
Figure 5
Figure 5
The Obesity of Ksr2−/− Mice Is Due to Increased Energy Intake and Decreased Energy Expenditure and Is Associated with Cold Intolerance Body weight of Ksr2−/− mice and WT littermates in response to ad libitum feeding and a pair-feeding paradigm. (A) At weaning, male mice (12 Ksr2+/+ and 4 Ksr2−/−) were fed ad libitum. 9 Ksr2−/−mice were pair-fed (PF) the amount of diet consumed ad libitum by Ksr2+/+ mice. Although only 1 of 7 Ksr2−/− mice fed ad libitum survived to 15 weeks of age, all pair-fed mice survived to 18 weeks of age. Numbers above the Ksr2−/− ad libitum group data reflect the number of Ksr2−/− ad libitum mice alive at the time of the body weight measurement; all other mice survived to the end of the study. (B) At weaning, female mice (10 Ksr2+/+ and 3 Ksr2−/−) were fed ad libitum. 6 Ksr2−/− mice were pair-fed (PF) to the amount of chow consumed ad libitum by Ksr2+/+ mice. (C and D) Fat mass of pair-fed male and female mice. (E) Rectal temperatures of 6 week-old male Ksr2+/+ (n = 9) and Ksr2−/− (n = 10) mice following cold exposure at 4°C. (F) Rectal temperatures of 6 week-old female Ksr2+/+ (n = 10) and Ksr2−/− (n = 9) mice following cold exposure at 4°C. (G) The same male mice presented in (E) were studied again at 10 weeks of age. (H) The same female mice presented in (F) were studied again at 10 weeks of age. Differences from WT: p < 0.05, ∗∗p < 0.01, ∗∗∗p < 0.001; KO-ad lib different from KO-PF and WT: ∧ p < 0.01, ∧∧ p < 0.001. Error bars represent SEM. See also Table S4 and Figure S4.
Figure 6
Figure 6
Human KSR2 Mutations Are Associated with Reduced Glucose and Fatty Acid Oxidation in Transfected Cells (A) Lysates from HEK293 cells transfected with the indicated KSR2 constructs were subjected to immunoprecipitation with Flag-agarose and immunoblotted with the indicated antibodies. (B) Measurement of glucose oxidation in C2C12 cells using the Seahorse XF24 extracellular flux analyzer. C2C12 cells overexpressing wild-type and mutant forms of KSR2 were stimulated with 2 μM FCCP and oxygen consumption rate (OCR) measured. Data were normalized to cell count by the sulphorhodamine B (SRB) assay. (C) Measurement of FAO in differentiated C2C12 cells using the Seahorse XF24 extracellular flux analyzer. C2C12 cells overexpressing wild-type and mutant forms of KSR2 were stimulated with 100 μM palmitate and OCR measured. Values represent the means of three independent experiments. Error bars represent SEM. The data are represented as % change from GFP-transfected control cells. (D) Effect of metformin on FAO. C2C12 myocytes overexpressing wild-type and mutant forms of KSR2 were stimulated with 100 μM palmitate (Pal) and OCR measured. Cells were preincubated with 1 mM metformin (Met) for 1 hr prior to the start of the assay and metformin was present in the reaction buffer during the assay. The data are represented as percentage (%) change from GFP transfected control cells. See also Figure S5.
Figure S1
Figure S1
Sequence Alignment of KSR2 Orthologs and KSR1, Related to Figure 1 Sequence alignment of human KSR2 (accession number Q6VAB6), mouse Ksr2 (Mus musculus accession number Q3UVC0), Rat Ksr2 (Rattus norvegicus accession number FILY04), Dog KSR2 (Canis familiaris accession number FIP721), Monkey KSR2 (Macaca mulatta accession number F7GRP4) and human KSR1 (accession number Q8IVT5). Sequence alignments were undertaken using a ClustalW alignment program (http://workbench.sdsc.edu/). Dark gray indicates completely conserved residues, mid gray shows partially conserved residues, while light gray indicates similar residues. The KSR2 nonsynonymous missense mutations are indicated in orange, the nonsense mutation Y569X is marked in red and the location of the three frameshift mutations V511Cfsx29, F807Qfsx41 and L822Pfsx26 are shown with a blue X. In addition the CA1-4 domains are shown with a blue box, the domain found only in KSR2 is shown with a green box and the kinase domain is marked with a red box.
Figure S2
Figure S2
Subcellular Localization of KSR2 Mutants and Colocalization with B-Raf, MEK, and ERK, Related to Figure 2 (A) Serum starved Cos7 cells transfected with Flag tagged WT or mutant KSR2 were stimulated with 100 ng/ml EGF for 5 min and fixed before immunostaining with an anti-Flag antibody (green) and DNA staining with DAPI (blue). Confocal optical sections were chosen that show KSR2 cellular localization in both the cytoplasm and plasma membrane ruffles. Scale bars, 10 μm. (B–D) Serum starved Cos7 cells transfected with Flag tagged WT or mutant KSR2 were stimulated with 100 ng/ml EGF for 5 min and fixed. Cells were coimmunostained with anti-Flag (green) and either: anti-B-Raf, anti-MEK or anti-ERK (red) antibodies and analyzed by confocal microscopy. Scale bars, 10 μm.
Figure S3
Figure S3
Effect of Frameshift Mutations and Nonsense Mutation upon the KSR2 Kinase Domain, Related to Figure 3 Amino acid sequences of wild-type KSR2 (500-end) are shown together with the truncated forms of KSR2 that result from each of the V511Cfsx29, F807Qfsx41 and L822Pfsx26 mutations. Sequence alignments were undertaken using http://workbench.sdsc.edu/. The ERK-binding motif is indicated along with key features of the KSR2 kinase domain.
Figure S4
Figure S4
Impaired Cold Tolerance in Ksr2 KO Mice and KSR2 Expression Pattern, Related to Figure 5 (A) Interscapular temperatures of 6 week-old male Ksr2+/+ (n = 9) and Ksr2−/− (n = 10) mice following cold exposure at 4°C. (B) Interscapular temperatures of 6 week-old female Ksr2+/+ (n = 10) and Ksr2−/− (n = 9) mice following cold exposure at 4°C. (C) As in A) except measurements were made on the same male mice at 10 weeks of age. (D) As in (B) except measurements were made on the same female mice at 10 weeks of age. Different from WT: p < 0.05, ∗∗p < 0.01, ∗∗∗p < 0.001. (E) Ksr2 expression in mouse hypothalamus by in situ hybridization. Arc, arcuate nucleus; DMH, dorsomedial hypothalamus; VMH, ventromedial hypothalamus. (F) Tissues isolated from fed wild-type mice were lysed and subjected to immunoblotting with the indicated antibodies. (G) Expression of KSR2 and KSR1 were studied by qualitative RT-PCR in a panel of human tissues.
Figure S5
Figure S5
Effects of Human KSR2 Mutations upon Glucose and Fatty Acid Oxidation, Related to Figure 6 (A) Measurement of glucose oxidation in intact C2C12 cells by Seahorse XF24 extracellular flux analyzer. The graphs show OCR versus time in the presence of 1 μg/ml oligomycin (OLIGO), 2 μM FCCP and 4 μg/ml rotenone/5 μM antimycin (ROT/ANT). (B) Measurement of FAO in differentiated C2C12 cells overexpressing WT and mutant forms of KSR2 by the Seahorse XF24 extracellular flux analyzer. Top left: basal oxygen consumption rate (OCR), top right: OCR after injection of 33 μM BSA or 100 μM palmitate (Pal), bottom left: OCR after injection of 50 μM etomoxir, bottom right: OCR change from basal. (C and D) Lysates from C2C12 cells transfected with the indicated KSR2 constructs were treated for 1 hr with 1 mM metformin and immunoblotted with the indicated antibodies.

Comment in

References

    1. Andersson U., Filipsson K., Abbott C.R., Woods A., Smith K., Bloom S.R., Carling D., Small C.J. AMP-activated protein kinase plays a role in the control of food intake. J. Biol. Chem. 2004;279:12005–12008. - PubMed
    1. Bost F., Aouadi M., Caron L., Even P., Belmonte N., Prot M., Dani C., Hofman P., Pagès G., Pouysségur J. The extracellular signal-regulated kinase isoform ERK1 is specifically required for in vitro and in vivo adipogenesis. Diabetes. 2005;54:402–411. - PubMed
    1. Brennan D.F., Dar A.C., Hertz N.T., Chao W.C., Burlingame A.L., Shokat K.M., Barford D. A Raf-induced allosteric transition of KSR stimulates phosphorylation of MEK. Nature. 2011;472:366–369. - PubMed
    1. Brommage R., Desai U., Revelli J.P., Donoviel D.B., Fontenot G.K., Dacosta C.M., Smith D.D., Kirkpatrick L.L., Coker K.J., Donoviel M.S. High-throughput screening of mouse knockout lines identifies true lean and obese phenotypes. Obesity (Silver Spring) 2008;16:2362–2367. - PubMed
    1. Canal F., Palygin O., Pankratov Y., Corrêa S.A., Müller J. Compartmentalization of the MAPK scaffold protein KSR1 modulates synaptic plasticity in hippocampal neurons. FASEB J. 2011;25:2362–2372. - PubMed

Publication types

MeSH terms