. 2013 Nov 5;105(9):2130-40.
doi: 10.1016/j.bpj.2013.09.020.

Molecular and subcellular-scale modeling of nucleotide diffusion in the cardiac myofilament lattice

Affiliations

Molecular and subcellular-scale modeling of nucleotide diffusion in the cardiac myofilament lattice

Peter M Kekenes-Huskey et al. Biophys J. .

Abstract

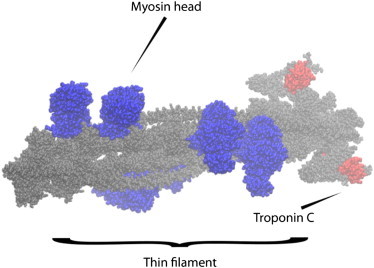
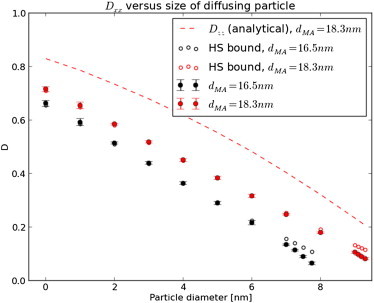
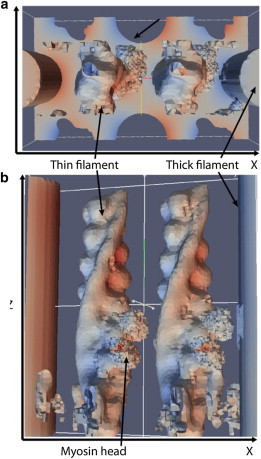
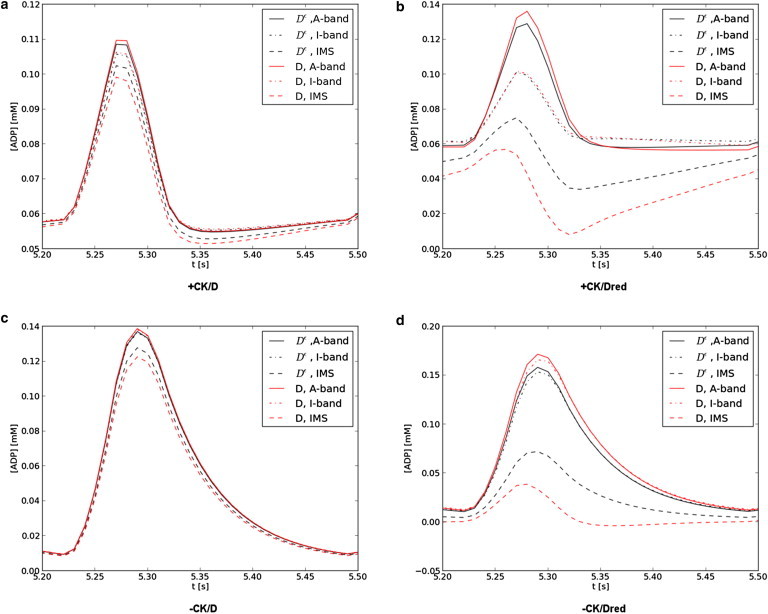
Contractile function of cardiac cells is driven by the sliding displacement of myofilaments powered by the cycling myosin crossbridges. Critical to this process is the availability of ATP, which myosin hydrolyzes during the cross-bridge cycle. The diffusion of adenine nucleotides through the myofilament lattice has been shown to be anisotropic, with slower radial diffusion perpendicular to the filament axis relative to parallel, and is attributed to the periodic hexagonal arrangement of the thin (actin) and thick (myosin) filaments. We investigated whether atomistic-resolution details of myofilament proteins can refine coarse-grain estimates of diffusional anisotropy for adenine nucleotides in the cardiac myofibril, using homogenization theory and atomistic thin filament models from the Protein Data Bank. Our results demonstrate considerable anisotropy in ATP and ADP diffusion constants that is consistent with experimental measurements and dependent on lattice spacing and myofilament overlap. A reaction-diffusion model of the half-sarcomere further suggests that diffusional anisotropy may lead to modest adenine nucleotide gradients in the myoplasm under physiological conditions.


Figures

Figure 1
Figure 1
Atomistic thin filament model. Side view of thin filament (gray) with six bound myosin heads (three cross-bridges, blue). Troponin C is marked (red) for reference.
Figure 2
Figure 2
Effect of myofibril lattice spacing on D. Predictions of the effective diffusion constant for myosin/actin spacings of 16.5 and 18.3 nm along the transverse direction based on the primitive unit cell in Fig. S1a in the Supporting Material as a function of diffusing particle size. Error bars represent the 95% confidence interval based on three trials of differing mesh resolutions. We include an analytical estimate for D parallel to the filaments (Dzz) for comparison. To see this figure in color, go online.
Figure 3
Figure 3
Solutions of the homogenized fields for a unit cell with atomistic-resolution geometries: (a) χx; (b) χz. Thin filament geometries of outer boundary are hidden for clarity.
Figure 4
Figure 4
ADP concentration profiles. [ADP]at several sarcomere locations with CK (a and b) and without (c and d), and with a normal (a and c) or 10-fold reduced (b and d) diffusion constant are given. [ADP] is reported at the filament overlap region of the A-band (solid), I-band (dashed), and adjacent to the intermembrane space (dot dash) for the isotropic (black) and anisotropic (red) diffusion constants. ADP profiles are in agreement with Fig. 10 of Van Beek (37). To see this figure in color, go online.
Figure 5
Figure 5
Maximal ADP gradients. Comparison of ADP gradients at t ≈ 5.3 s in the presence (blue) and absence (red) of CK activity, and with normal (solid) and 10-fold reduced (patterned) diffusion coefficients. Gradients are defined based on [ADP] at the A-band relative to the interface with the intermembrane space. Error bars represent 95% confidence interval based on 10 trials where the diffusion constant was randomly varied within one standard deviation (0.035) of the estimated values from homogenization (see the Supporting Material). To see this figure in color, go online.

References

    1. Bers D. 1st Ed. Vol. 1. Kluwer Academic Publishers; Dordrecht, The Netherlands: 2001. (Excitation-Contraction Coupling and Cardiac Contractile Force).
    1. Michailova A.A., Saucerman J.J., McCulloch A.D.A. Modeling regulation of cardiac KATP and L-type Ca2+ currents by ATP, ADP, and Mg2+ Biophys. J. 2005;88:2234–2249. - PMC - PubMed
    1. Kinsey S.T., Locke B.R., Dillaman R.M. Molecules in motion: influences of diffusion on metabolic structure and function in skeletal muscle. J. Exp. Biol. 2011;214:263–274. - PMC - PubMed
    1. Selivanov V.A., Krause S., Cascante M. Modeling of spatial metabolite distributions in the cardiac sarcomere. Biophys. J. 2007;92:3492–3500. - PMC - PubMed
    1. Illaste A., Laasmaa M., Vendelin M. Analysis of molecular movement reveals latticelike obstructions to diffusion in heart muscle cells. Biophys. J. 2012;102:739–748. - PMC - PubMed

Publication types

LinkOut - more resources