. 2013 Dec;447(1-2):63-73.
doi: 10.1016/j.virol.2013.08.034. Epub 2013 Sep 19.

TGF-β regulation of gene expression at early and late stages of HPV16-mediated transformation of human keratinocytes

Affiliations

TGF-β regulation of gene expression at early and late stages of HPV16-mediated transformation of human keratinocytes

Sangeeta Kowli et al. Virology. 2013 Dec.

Abstract

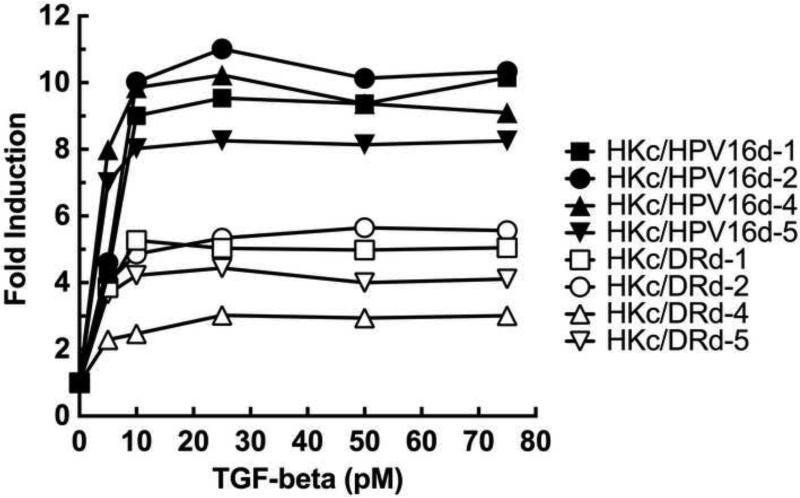
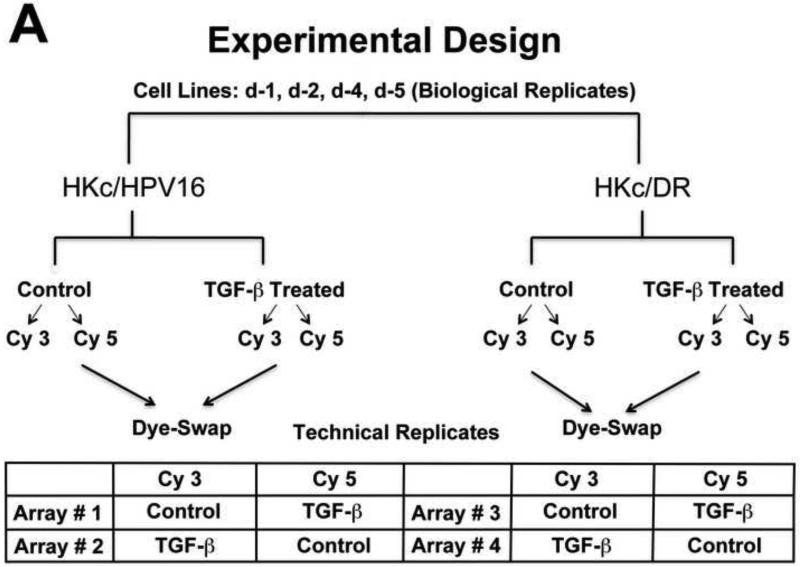
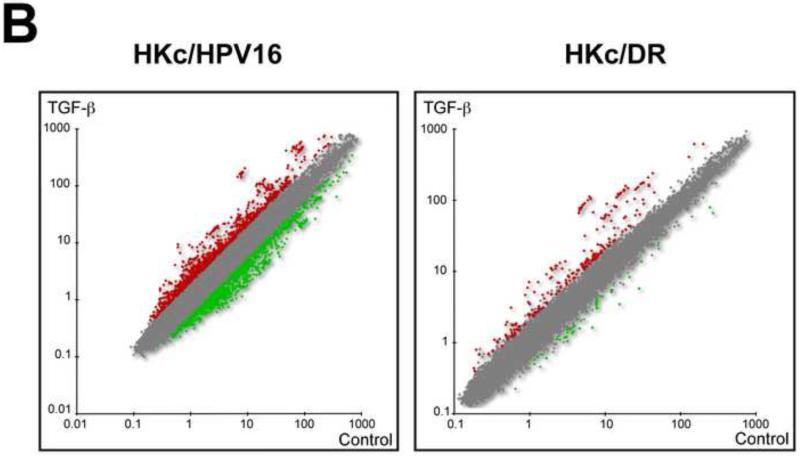
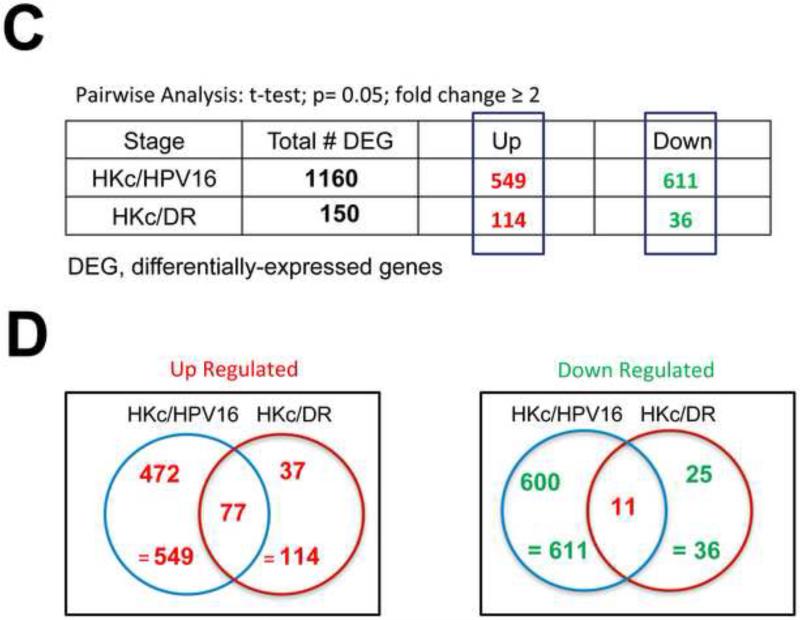
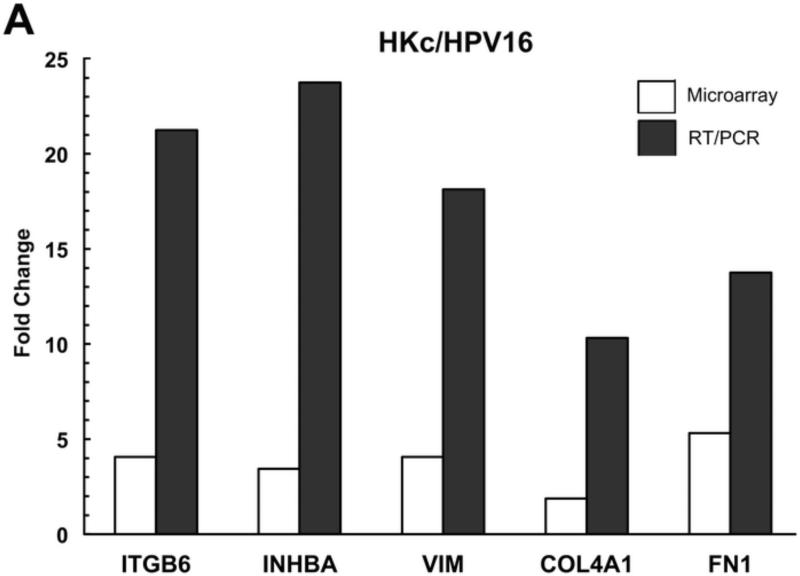
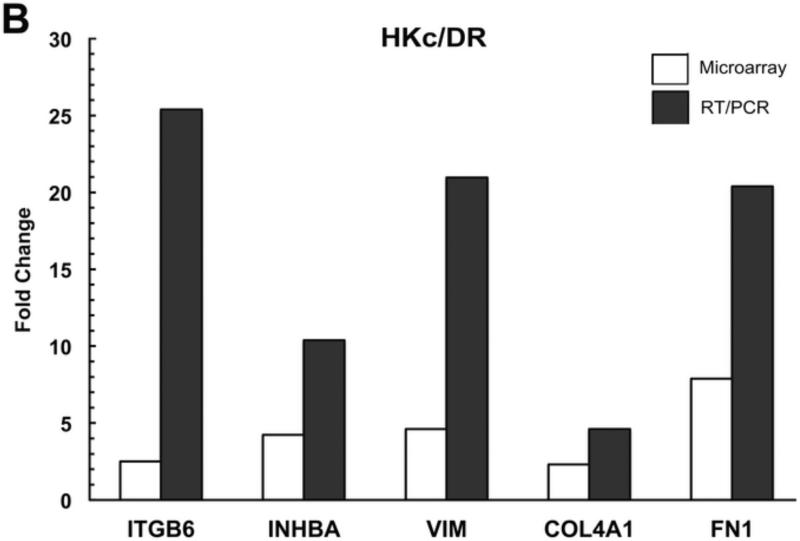
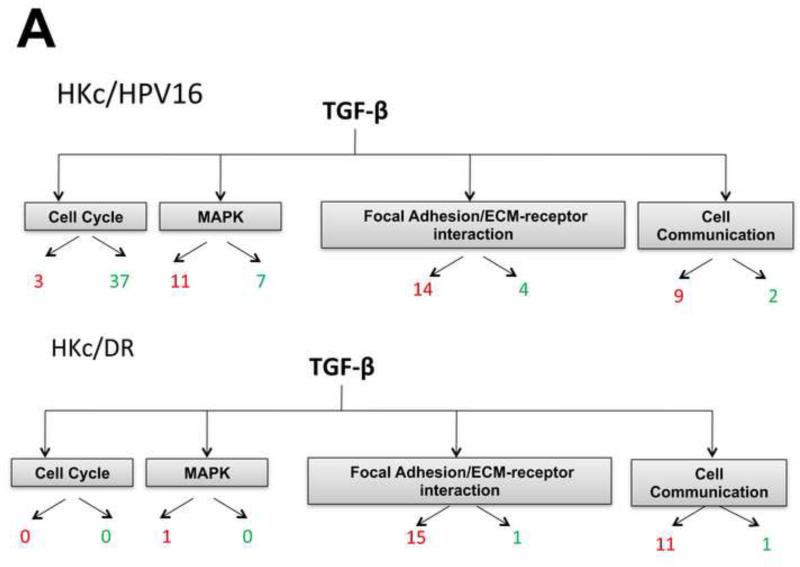
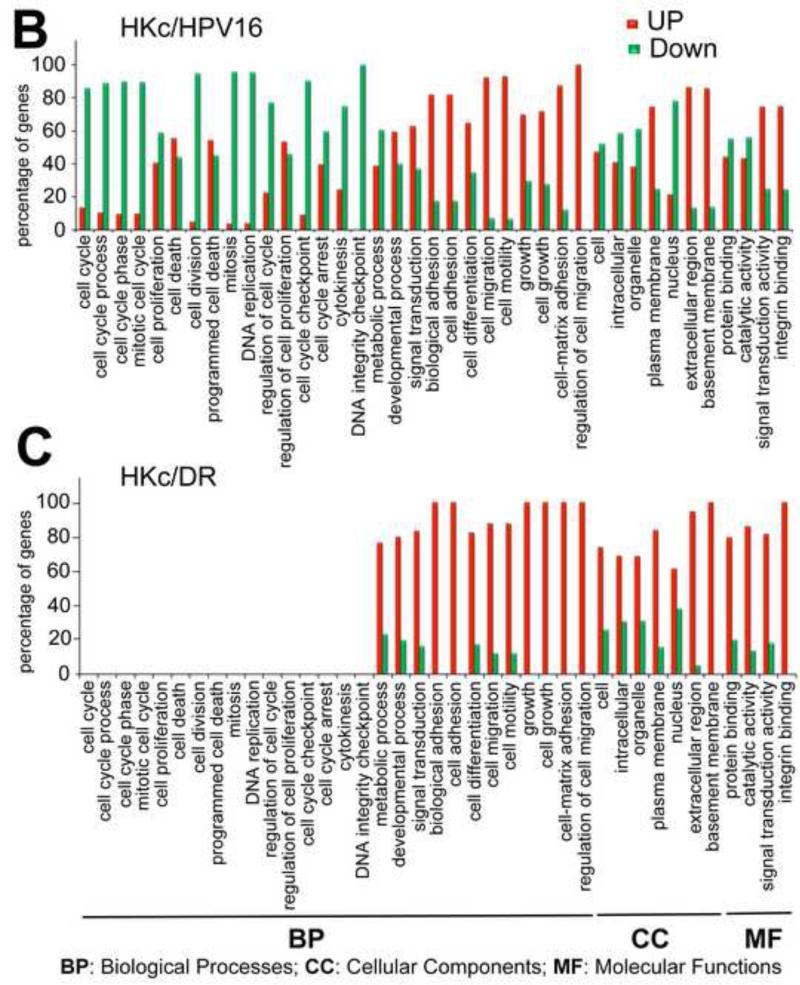
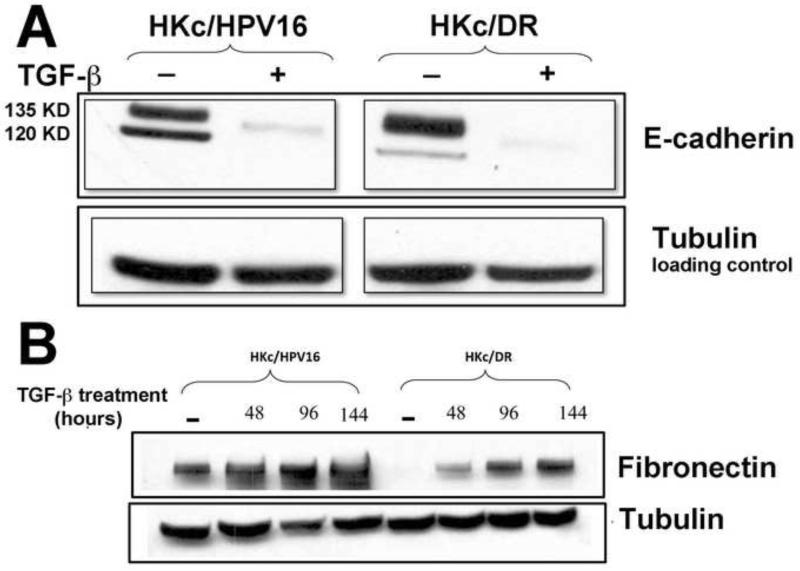
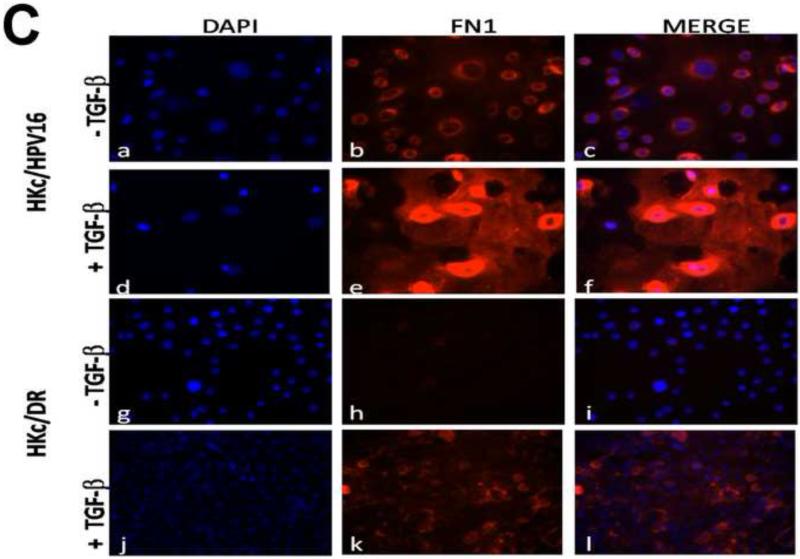
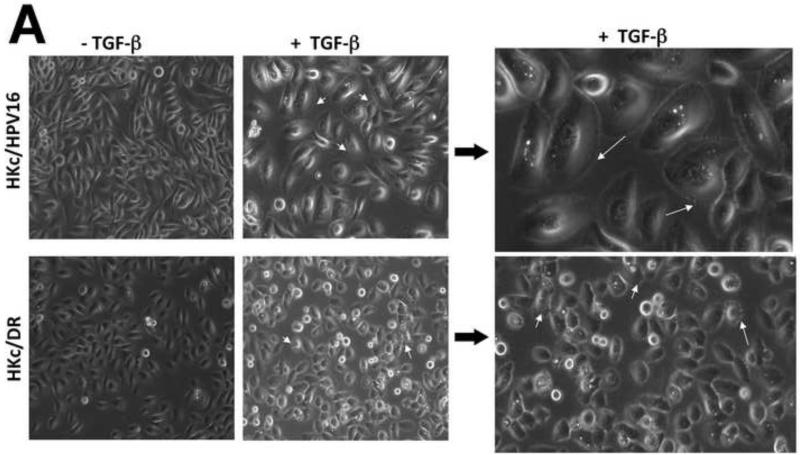
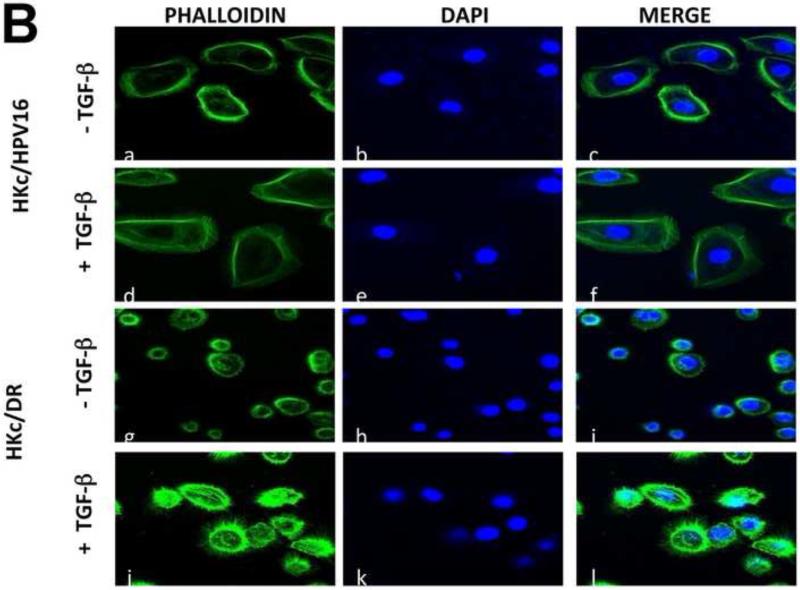
In our in vitro model for HPV16-mediated transformation, HPV16-immortalized human keratinocytes (HKc/HPV16) give rise to differentiation resistant, premalignant cells (HKc/DR). HKc/DR, but not HKc/HPV16, are resistant to growth inhibition by transforming growth factor beta (TGF-β), due to a partial loss of TGF-β receptor type I. We show that TGF-β activates a Smad-responsive reporter construct in HKc/DR to about 50% of the maximum levels of activation observed in HKc/HPV16. To investigate the functional significance of residual TGF-β signaling in HKc/DR, we compared gene expression profiles elicited by TGF-β treatment of HKc/HPV16 and HKc/DR on Agilent 44k human whole genome microarrays. TGF-β altered the expression of cell cycle and MAP kinase pathway genes in HKc/HPV16, but not in HKc/DR. However, epithelial-mesenchymal transition (EMT) responses to TGF-β were comparable in HKc/HPV16 and HKc/DR, indicating that the signaling pathways through which TGF-β elicits growth inhibition diverge from those that induce EMT in HPV16-transformed cells.

Keywords: EMT; HPV; Human keratinocytes; Ski; Smad; TGF-beta.


Figures

Figure 1
Figure 1. TGF-β activation of a Smad-responsive luciferase reporter construct in HKc/HPV16 and HKc/DR
Four HKc/HPV16 and their corresponding HKc/DR lines (d-1, d-2, d-4 and d-5) were transiently transfected in triplicate wells per experimental condition with the p6SBE-Luc reporter construct and pRL-SV40. Cells were treated without or with the indicated concentrations of TGF-β1 24 h after transfection, and harvested for dual luciferase assay after 22 h of TGF-β treatment. Firefly luciferase values, measured in Relative Light Units (RLU), were normalized against Renilla luciferase values, and the results expressed as fold induction over control (without TGF-β).
Figure 2
Figure 2. Experimental design and initial analysis of microarray experiments
(A) Experimental design: Four separate HKc/HPV16 lines and their respective HKc/DR counterparts were treated without or with 40 pM TGF-β for 48 h before harvesting. Labeled RNA samples, using a dye-swap design, were hybridized to Agilent 4x44k whole human genome microarrays for each of the HKc/HPV16 and HKc/DR lines, resulting in eight microarrays per transformation stage of the model system. RNA amplification, hybridization, washing and scanning for each individual donor (HKc/HPV16 and HKc/DR) were performed at the same time on separate dates. (B) Scatter plot of gene expression levels detected by microarray analysis described in A. Red: genes up-regulated by ≥ 2- fold; green: genes down-regulated by ≥ 2- fold; gray: genes exhibiting no statistically significant change, or < 2-fold change in expression between TGF-β treated and control cells. (C) Numbers of genes significantly changed in HKc/HPV16 and HKc/DR as a consequence of TGF-β treatment. (D) Venn diagrams showing how many genes are up- or down-regulated (≥ 2 fold) in all four HKc/HPV16 and HKc/DR lines after TGF-β treatment, and how many of the TGF-β regulated genes are common between HKc/HPV16 and HKc/DR. red: ≥ 2-fold up-regulated, green ≥ 2-fold down-regulated.
Figure 3
Figure 3. RT/PCR validation of microarray results
Fold-change induced by TGF-β of the expression of a panel of genes, determined by microarray analysis (open bars) and RT-PCR (solid bars) in HKc/HPV16 (A) and HKc/DR (B).
Figure 3
Figure 3. RT/PCR validation of microarray results
Fold-change induced by TGF-β of the expression of a panel of genes, determined by microarray analysis (open bars) and RT-PCR (solid bars) in HKc/HPV16 (A) and HKc/DR (B).
Figure 4
Figure 4. KEGG pathway analysis of differentially expressed genes
(A) Summary of KEGG analysis results for genes belonging to the cell cycle, MAPK, focal adhesion/ECM-receptor interaction and cell communication pathways found changed by TGF-β treatment in HKc/HPV16 (upper panel) and HKc/DR (lower panel). Red: ≥ 2-fold up-regulated; green β 2-fold down-regulated by TGF-β. (B, C) Gene ontology analysis of differentially expressed genes as determined using the GeneSifter software. The y-axis represents the percentage of genes changed up or down, within each group of genes (in each cellular process) that changed in response to 48 h of TGF-β treatment (40 pM) in HKc/HPV16 (B) and HKc/DR (C) by β 2-fold. Data are grouped into different ontology groups (x-axis) and each is further separated into increased (red bars) and decreased (green bars) expression.
Figure 5
Figure 5. TGF-β decreases E-cadherin and increases fibronectin protein levels in HKc/HPV16 and HKc/DR
Whole-protein lysates were prepared from HKc/HPV16 and HKc/DR treated without or with TGF-β (40 pM) for 48 h (A) or for the indicated times (B) and Western blot analysis was performed for E-cadherin (A), fibronectin (B) or tubulin (A, B) as a loading control. (C) Control and TGF-β treated (40 pM for 96 h) HKc/HPV16 and HKc/DR were fixed in 4% paraformaldehyde. Slides were stained with DAPI to visualize nuclei (blue; panels a, d, g, and j) and with anti-fibronectin antibody (FN1) (red; panels b, e, h, and k). Merged images are presented in panels c, f, i, and l.
Figure 6
Figure 6. TGF-β induces morphological changes, re-organizes actin cytoskeleton, and enhances cell migration in HKc/HPV16 and HKc/DR
(A) Cells were treated with or without TGF-β (40 pM for 4 days) and examined under phase contrast using a Zeiss Axiovert 200 inverted microscope. White arrows show projections protruding out from the cell surface of HKc/HPV16 and HKc/DR. (B) F-actin was stained with Alexa fluor-488 labeled Phalloidin and nuclei with DAPI in HKc/HPV16 and HKc/DR, which were then visualized under a confocal microscope. F-actin, green: panels a, d, g and j; nuclei, blue: panels b, e, h and k. Merged images are presented in panels c, f, i, and l. (C) Quantification of scratch assay. HKc/HPV16 and HKc/DR were grown to confluence and treated with or without 40 pM TGF-β1 for 12 h. Wounds were then incised by scratching the cell monolayer with a pipet tip, and incubation with or without TGF-β1 continued for 36 h. Images were captured under phase-contrast microscopy at 6 h intervals after the incision and quantified with ImageJ. At least ten measurements of the width of the gap were assessed for each time point, starting at the 6 h time point and continuing until 36 h after the scratch.

Similar articles

Cited by

References

    1. Baldwin A, Pirisi L, Creek KE. NFI-Ski interactions mediate transforming growth factor beta modulation of human papillomavirus type 16 early gene expression. Journal of virology. 2004;78:3953–3964. - PMC - PubMed
    1. Batova A, Danielpour D, Pirisi L, Creek KE. Retinoic acid induces secretion of latent transforming growth factor beta 1 and beta 2 in normal and human papillomavirus type 16-immortalized human keratinocytes. Cell growth & differentiation : the molecular biology journal of the American Association for Cancer Research. 1992;3:763–772. - PubMed
    1. Bernat A, Avvakumov N, Mymryk JS, Banks L. Interaction between the HPV E7 oncoprotein and the transcriptional coactivator p300. Oncogene. 2003;22:7871–7881. - PubMed
    1. Bheda A, Creek KE, Pirisi L. Loss of p53 induces epidermal growth factor receptor promoter activity in normal human keratinocytes. Oncogene. 2008;27:4315–4323. - PMC - PubMed
    1. Bhowmick NA, Ghiassi M, Bakin A, Aakre M, Lundquist CA, Engel ME, Arteaga CL, Moses HL. Transforming growth factor-beta1 mediates epithelial to mesenchymal transdifferentiation through a RhoA-dependent mechanism. Mol Biol Cell. 2001;12:27–36. - PMC - PubMed

Publication types

Substances