. 2013 Nov 25;27(4):425-37.
doi: 10.1016/j.devcel.2013.10.007. Epub 2013 Nov 7.

Self-assembly of VPS41 promotes sorting required for biogenesis of the regulated secretory pathway

Affiliations

Self-assembly of VPS41 promotes sorting required for biogenesis of the regulated secretory pathway

Cédric S Asensio et al. Dev Cell. .

Abstract

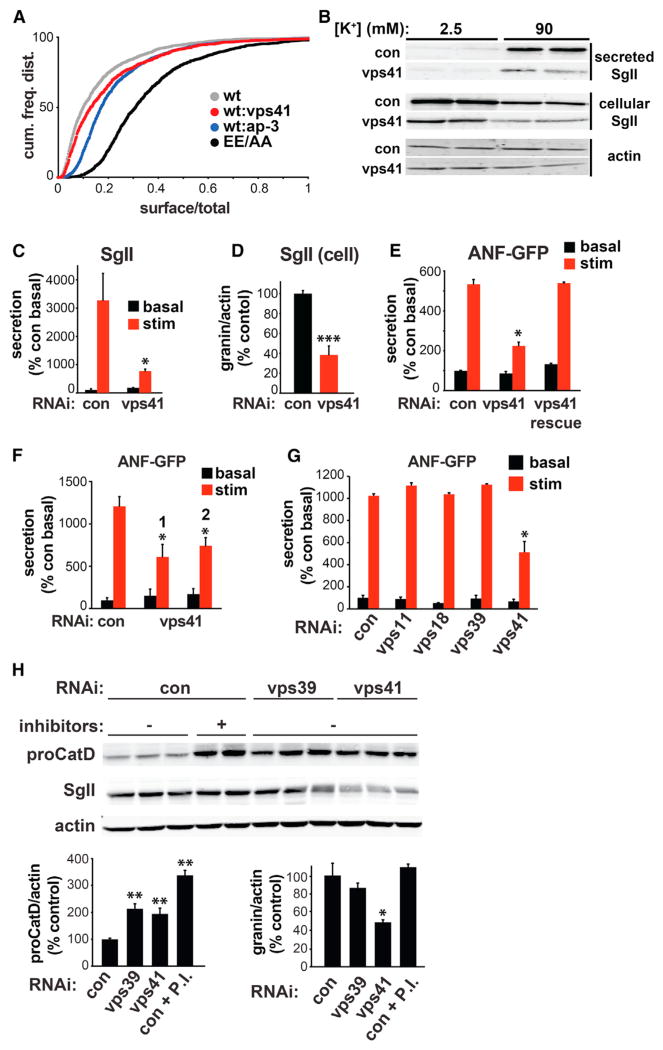
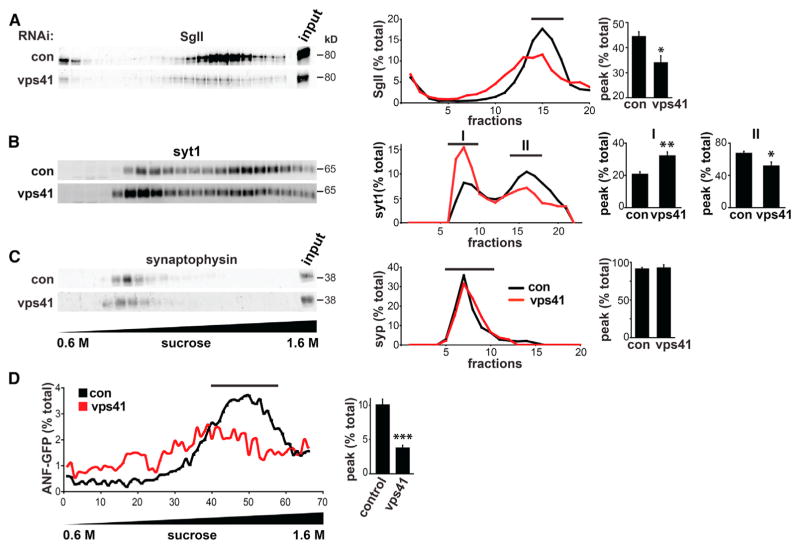
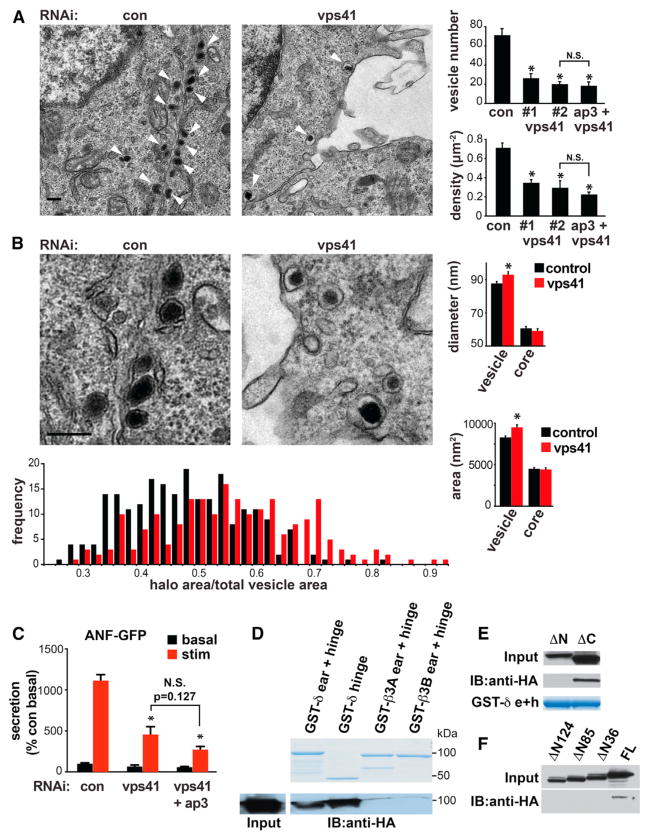
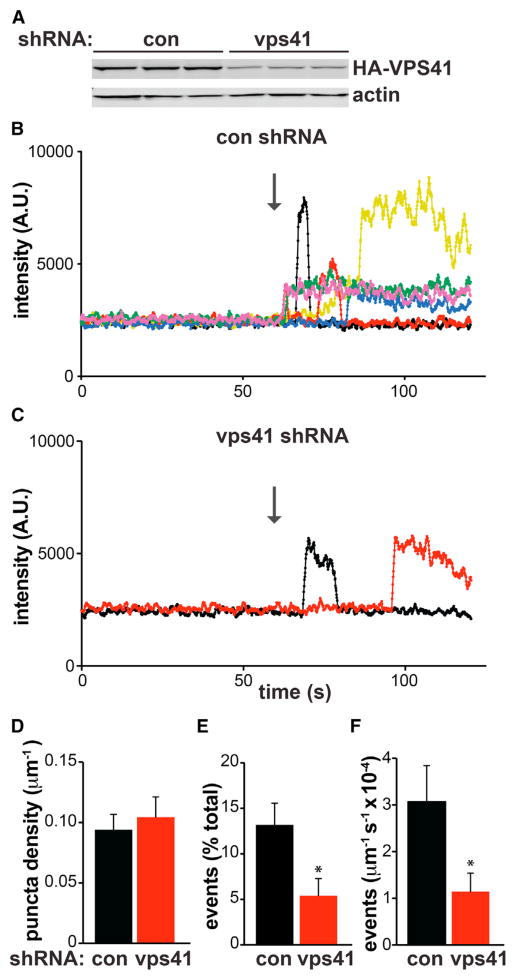
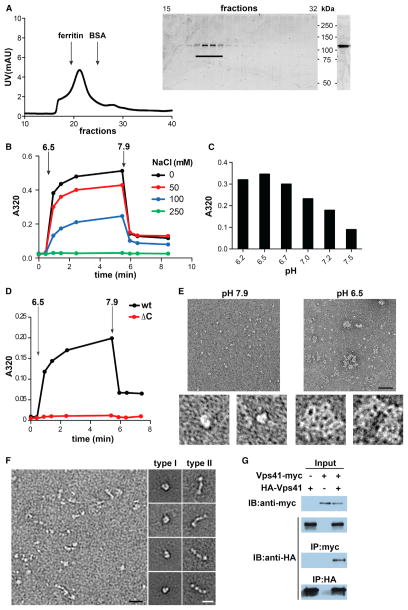
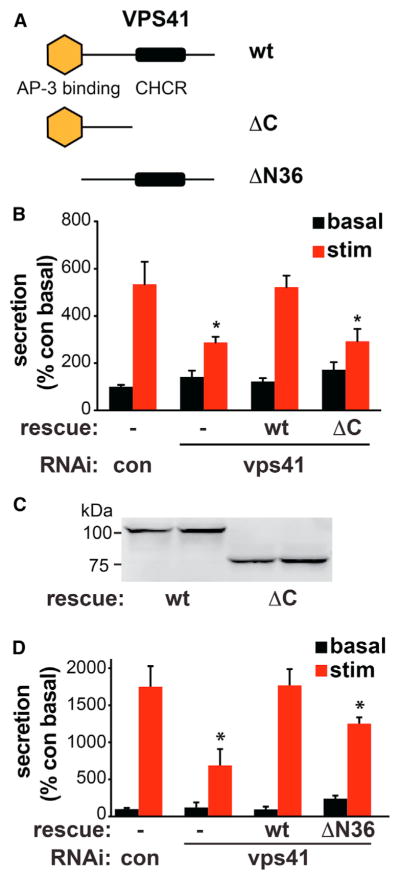
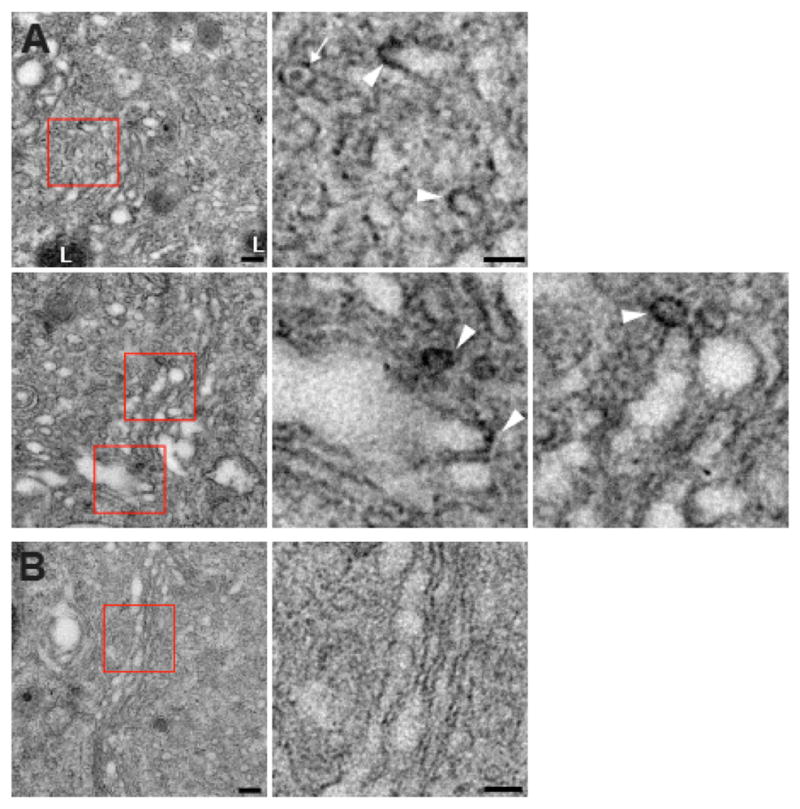
The regulated release of polypeptides has a central role in physiology, behavior, and development, but the mechanisms responsible for production of the large dense core vesicles (LDCVs) capable of regulated release have remained poorly understood. Recent work has implicated cytosolic adaptor protein AP-3 in the recruitment of LDCV membrane proteins that confer regulated release. However, AP-3 in mammals has been considered to function in the endolysosomal pathway and in the biosynthetic pathway only in yeast. We now find that the mammalian homolog of yeast VPS41, a member of the homotypic fusion and vacuole protein sorting (HOPS) complex that delivers biosynthetic cargo to the endocytic pathway in yeast, promotes LDCV formation through a common mechanism with AP-3, indicating a conserved role for these proteins in the biosynthetic pathway. VPS41 also self-assembles into a lattice, suggesting that it acts as a coat protein for AP-3 in formation of the regulated secretory pathway.


Figures

Figure 1
Figure 1. VPS41, but Not Other HOPS Complex Subunits, Is Required for the Regulated Secretory Pathway in PC12 Cells
(A) PC12 cells were cotransfected with EE/AA or wild-type VMAT2 (tagged with a lumenal/external HA epitope) and the siRNAs indicated, incubated for 2 hr with HA antibody conjugated to Alexa 647, washed and the fluorescence of individual cells measured by flow cytometry. The cumulative frequency distribution of surface (red)/total (green) VMAT2 shows an increase with RNAi to VPS41 as well as AP-3. p < 10 × 10−12 relative to wild-type control by Kolmogorov-Smirnov. (B–D) PC12 cells were transiently transfected with either control or VPS41 siRNA, washed and incubated for 30 min in Tyrode’s solution containing 2.5 mM K+ (basal) or 90 mM K+ (stimulated). Cellular and secreted secretogranin II (SgII) were measured by quantitative fluorescent immunoblotting (B), with the secreted SgII normalized to basal secretion in the control (C), and the cellular SgII normalized to actin (D). The immunoblots in (B) show two representative, independent samples. *p < 0.01 relative to stimulated secretion from control (n = 6); ***p < 0.001 relative to control (n = 6). (E) PC12 cells were cotransfected with ANF-GFP as well as the indicated siRNAs in the presence (rescue) or absence of RNAi-resistant VPS41-myc, washed and incubated for 30 min in Tyrode’s solution containing 2.5 mM (basal) or 90 mM (stimulated) K+. Cellular and secreted ANF-GFP were measured using a plate reader, the results normalized to cellular content and expressed relative to basal release from the cells treated with control siRNA. *p < 0.001 relative to stimulated secretion from control (n = 4–6). (F) PC12 cells were cotransfected with ANF-GFP and either control or VPS41 siRNAs #1 or #2 and the secretion of ANF-GFP in response to stimulation measured as described above. *p < 0.05 relative to stimulated secretion from control (n = 3–4). (G) PC12 cells were cotransfected with ANF-GFP as well as the indicated siRNAs and stimulation-dependent ANF-GFP secretion determined as above (n = 4). (H) PC12 cells were transfected with siRNA and incubated where indicated with protease inhibitors antipapain (10 μM), leupeptin (10 μM), and pepstatin A (5 μM) (P.I.) for 20 hr. Cellular proCathepsin D (proCatD) and SgII were quantified by fluorescent western analysis and the values normalized to actin immunoreactivity. *p < 0.05; **p < 0.01 relative to control (n = 4–6). (C–H) The data shown indicate mean ± SEM. See also Figure S1 and Table S1.
Figure 2
Figure 2. VPS41 RNAi Shifts LDCV Cargo to Lighter Membranes by Equilibrium Sedimentation
(A–C) PC12 cells were transfected twice with VPS41 siRNA, and the postnuclear supernatant (input) obtained 2–3 days after the second transfection was separated by equilibrium sedimentation through 0.6–1.6 M sucrose. Fractions were collected from the top of the gradient and assayed for SgII (A), synaptotagmin 1 (syt1) (B), and synaptophysin (syp) (C) by quantitative fluorescent immunoblotting. The graphs (middle) quantify multiple immunoblots of the kind shown on the left, with the immunoreactivity in each fraction expressed as a percent of total gradient immunoreactivity. Bar graphs (right) indicate the area under the relevant peak (indicated by a black line) expressed as a percent of the area under the entire curve. *p < 0.05; **p < 0.01 relative to control (n = 3–4). (D) PC12 cells were cotransfected with VPS41 siRNA and ANF-GFP and the postnuclear supernatant sedimented as above. In this case, however, ~70 fractions were collected from the top of the gradient directly into a 96-well plate, and the fluorescence of ANF-GFP was measured using a plate reader. The graph indicates ANF-GFP fluorescence for each fraction expressed as percent of total gradient fluorescence. Bar graphs show the area under the curve for the peak (indicated by the black line) expressed as percent of total area. ***p < 0.001 relative to control by two-tailed Student’s t test (n = 3). (A–D) The bar graphs represent mean ± SEM.
Figure 3
Figure 3. VPS41 Influences LDCV Morphology and Interacts with AP-3 Genetically and Biochemically
PC12 cells were transfected twice with either control, VPS41 (#1 or #2) siRNA (50 nM each), or VPS41 siRNA #2 with AP-3 siRNA (50 nM each) and processed for electron microscopy 2 days after the second transfection. (A) Low-magnification electron micrographs show a large reduction in the number of LDCVs (arrowheads) in cells transfected with VPS41 siRNA (right) relative to controls (left). Bar graphs indicate the number of LDCVs per cell section (upper panel) and LDCV density (lower panel). *p < 0.001 relative to control (n = 20 cells/condition). (B) Higher magnification electron micrographs show that VPS41 RNAi slightly increases the size of LDCVs, and in particular, the halo surrounding the dense core. Bar graphs indicate the diameter (upper panel) and area (lower panel) of both the entire LDCV and the electron-dense core. Subtracting the area of the core from total LDCV area yields the area occupied by the halo, and the fraction of LDCV area occupied by the halo is presented as a frequency histogram (below). *p < 0.01 from control (n = 204–221 LDCVs/condition). The scale bars represent 200 nm. (C) PC12 cells were cotransfected with ANF-GFP as well as control, VPS41 or VPS41 with AP-3 siRNAs as indicated. ANF-GFP secretion was measured as described in Figure 1E. *p < 0.01 relative to stimulated secretion from control (n = 4). (A–C) Bar graphs represent mean ± SEM. (D–F) Cell lysates were prepared from COS7 cells transfected with full-length HA-VPS41 (D) or HA-VPS41 lacking the N or C terminus (E and F), incubated with GSH Sepharose-bound GST-δ ear + hinge (residues 720–1,204), GST-δ hinge (residues 650–720), GST-β3A (residues 643–1,094), or GST-β3B (residues 633–1,082) and the bound proteins eluted in sample buffer analyzed by immunoblotting for HA. See also Figure S2.
Figure 4
Figure 4. VPS41 RNAi Impairs Regulated Exocytosis of LDCVs by Hippocampal Neurons
(A) PC12 cells were transiently cotransfected with HA-VPS41 and either control or VPS41 shRNA. Immunoblotting the extracts for HA shows a substantial reduction with VPS41 shRNA relative to control. (B–F) Postnatal rat hippocampal neurons were cotransfected with synaptophysin-mCherry, NPY-pHluorin, and either control or VPS41 shRNA. After 14 DIV, the cells were imaged under basal conditions for 60 s, followed by stimulation at 30 Hz for 45 s. (B and C) Representative fluorescent traces (a moving average of 10 data points) show exocytotic events in axons (identified with synaptophysin-mCherry) in response to stimulation (indicated with an arrow) for neurons transfected with control (B) or VPS41 shRNA (C). The bar graphs (D–F) quantify the live-imaging data. (D) The total number of NPY-pHluorin puncta (puncta revealed in NH4Cl plus exocytotic events) does not change in response to VPS41 shRNA. However, VPS41 shRNA reduces the number of stimulated NPY-pHluorin events expressed either as percent of total puncta (E) or normalized to axon length (F). *p < 0.05 relative to control by two-tailed Student’s t test (n = 25). The bar graphs represent mean ± SEM.
Figure 5
Figure 5. VPS41 Self-Assembles into a Lattice In Vitro
(A) Full-length hVPS41 was purified from Sf9 cells by metal affinity chromatography followed by gel filtration (Superdex 200) in 10 mM Tris, pH 7.9 (left). Aliquots of the collected fractions were separated by electrophoresis through polyacrylamide (SDS-PAGE) and the proteins visualized by Coomassie staining (middle). Fractions containing monomeric hVPS41 were pooled, concentrated, and again visualized by Coomassie staining after SDS-PAGE (right). (B–D) All self-assembly reactions were performed using ~10 μg protein in a total volume of 100 μl in the absence of NaCl unless otherwise indicated. Light-scattering measurements were taken before (t = 0) and after the addition of MES, pH 6.5 (B and D) or at the indicated pH (C). After 5 min, disassembly was triggered by the addition of Tris, pH 9.0. The bar graph (C) shows the values obtained after 5 min of assembly. (E) Negative stain EM of recombinant hVPS41 shows single particles under conditions that do not permit assembly (left, pH 7.9) and irregular lattices (right) at low pH (6.5). The panels on the bottom show single particles (left) or a lattice (right) at higher magnification. Size bar represents 50 nm. (F) Electron micrographs of unassembled hVPS41 (left panel) reveal two main types of particle: C-shaped (type I) and elongated (type II). Representative class averages for both particle types were computed from single particles sets and are shown on the right. Size bar represents 20 nm. (G) COS7 cells were transfected with HA-VPS41 with or without VPS41-myc, as indicated. Cell lysates were immunoprecipitated with HA antibody and samples examined by immunoblotting with anti-myc or anti-HA antibodies (lower blots). Upper immunoblots show the expression of HA-VPS41 and VPS41-myc in the cell lysates. See also Figure S3.
Figure 6
Figure 6. The VPS41 Clathrin Heavy Chain Repeat Is Required for Regulated Secretion
(A) Model of VPS41 showing the putative AP-3 binding site at the N terminus as well as the CHCR at the C terminus. The ΔC mutant contains residues 1–595 and ΔN36 residues 37–853. (B) PC12 cells were cotransfected with control or VPS41 siRNAs, ANF-GFP, and RNAi-resistant VPS41 full-length (WT) and C-terminal deletion (ΔC) rescue constructs where indicated, and ANF-GFP secretion was measured as described in Figure 1E. *p < 0.05 relative to stimulated secretion from control (n = 3–4). Bar graphs represent mean ± SEM. (C) Western analysis of the HA-tagged, RNAi-resistant constructs transfected in duplicate into PC12 cells shows equivalent expression of WT and ΔC VPS41. (D) PC12 cells were cotransfected with control or VPS41 siRNAs, ANF-GFP, and RNAi-resistant WT or ΔN36 VPS41, and ANF-GFP secretion measured as described in Figure 1E. *p < 0.05 by ANOVA followed by Tukey posthoc testing, relative to stimulated secretion from control (n = 4). Bar graphs represent mean ± SEM.
Figure 7
Figure 7. VPS41 Decorates Golgi-Derived Membrane Buds
PC12 cells were transfected twice with VPS41 siRNA and once with cDNA encoding either siRNA-resistant miniSOG-VPS41 (A) or cytoplasmic miniSOG (B) alone as control. Three days after the second transfection, cells were fixed, oxidized by blue light in the presence of oxygen and DAB, and processed for EM. (A) Electron micrographs show electron-dense DAB reaction product closely apposed to membrane buds associated with the ends of Golgi cisternae in cells transfected with miniSOG-VPS41. Red boxes indicate the regions magnified to the right. The white arrowheads indicate electron-dense deposits and the white arrow an unlabeled LDCV. (B) A cell expressing the cytoplasmic miniSOG shows an unlabeled Golgi profile. Scale bars represent 200 nm. L, lysosome. See also Figure S4.

References

    1. Akbar MA, Ray S, Krämer H. The SM protein Car/Vps33A regulates SNARE-mediated trafficking to lysosomes and lysosome-related organelles. Mol Biol Cell. 2009;20:1705–1714. - PMC - PubMed
    1. Angers CG, Merz AJ. HOPS interacts with Apl5 at the vacuole membrane and is required for consumption of AP-3 transport vesicles. Mol Biol Cell. 2009;20:4563–4574. - PMC - PubMed
    1. Aoyama M, Sun-Wada GH, Yamamoto A, Yamamoto M, Hamada H, Wada Y. Spatial restriction of bone morphogenetic protein signaling in mouse gastrula through the mVam2-dependent endocytic pathway. Dev Cell. 2012;22:1163–1175. - PubMed
    1. Arvan P, Castle D. Sorting and storage during secretory granule biogenesis: looking backward and looking forward. Biochem J. 1998;332:593–610. - PMC - PubMed
    1. Asensio CS, Sirkis DW, Edwards RH. RNAi screen identifies a role for adaptor protein AP-3 in sorting to the regulated secretory pathway. J Cell Biol. 2010;191:1173–1187. - PMC - PubMed

Publication types

MeSH terms

Substances