

Brain hyperconnectivity in children with autism and its links to social deficits
- PMID: 24210821
- PMCID: PMC3894787
- DOI: 10.1016/j.celrep.2013.10.001
Brain hyperconnectivity in children with autism and its links to social deficits
Abstract
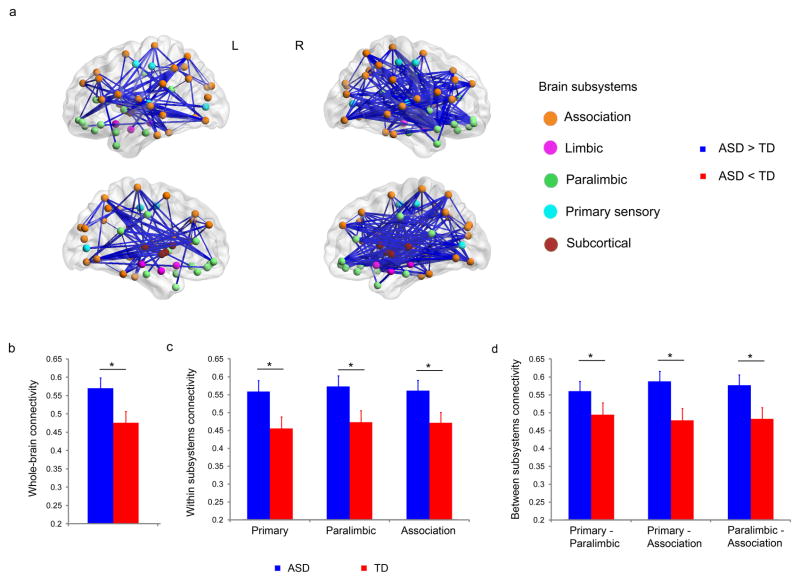
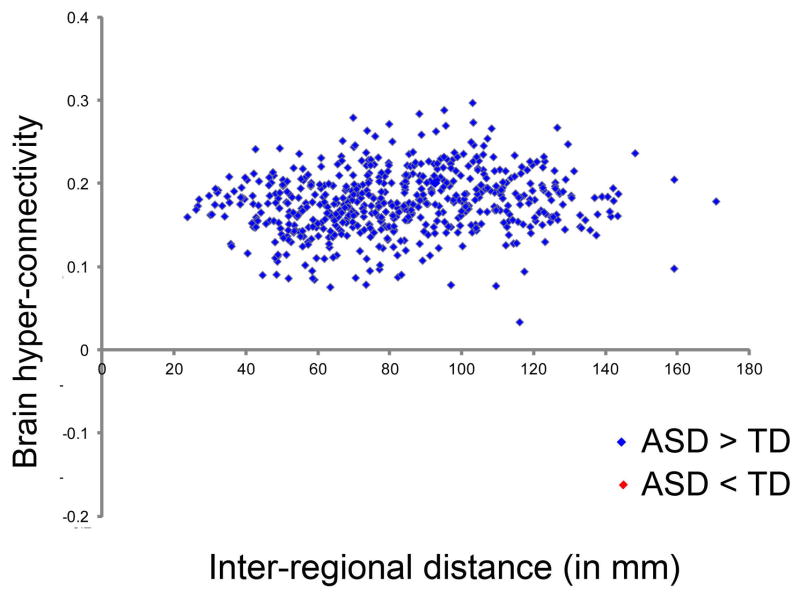
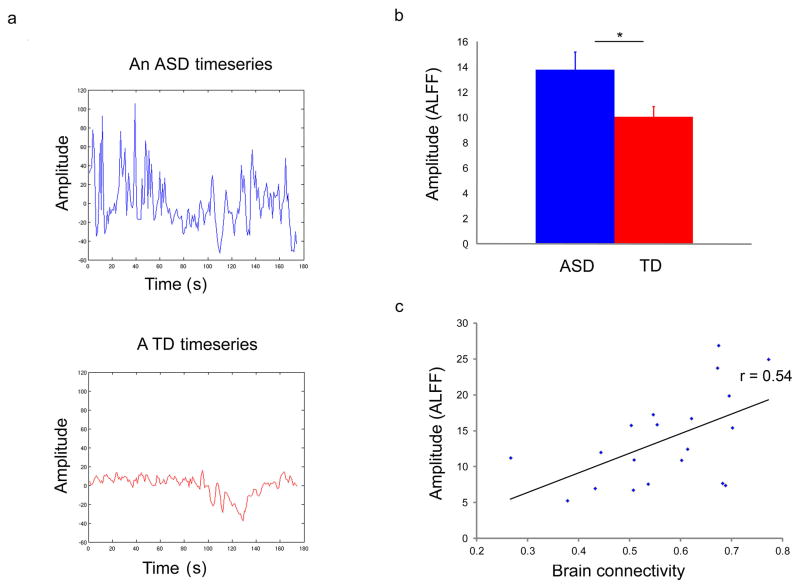
Autism spectrum disorder (ASD), a neurodevelopmental disorder affecting nearly 1 in 88 children, is thought to result from aberrant brain connectivity. Remarkably, there have been no systematic attempts to characterize whole-brain connectivity in children with ASD. Here, we use neuroimaging to show that there are more instances of greater functional connectivity in the brains of children with ASD in comparison to those of typically developing children. Hyperconnectivity in ASD was observed at the whole-brain and subsystems levels, across long- and short-range connections, and was associated with higher levels of fluctuations in regional brain signals. Brain hyperconnectivity predicted symptom severity in ASD, such that children with greater functional connectivity exhibited more severe social deficits. We replicated these findings in two additional independent cohorts, demonstrating again that at earlier ages, the brain of children with ASD is largely functionally hyperconnected in ways that contribute to social dysfunction. Our findings provide unique insights into brain mechanisms underlying childhood autism.
Copyright © 2013 The Authors. Published by Elsevier Inc. All rights reserved.
Figures
Comment in
-
Convergent evidence of brain overconnectivity in children with autism?Cell Rep. 2013 Nov 14;5(3):565-6. doi: 10.1016/j.celrep.2013.10.043. Cell Rep. 2013. PMID: 24238089 Free PMC article.
References
-
- American Psychiatric Association. Diagnostic criteria from DSM-IV-TR. Washington, D.C: American Psychiatric Association; 2000.
-
- Baio J. Prevalence of autism spectrum disorders - autism and developmental disabilities monitoring network, 14 sites, United States, 2008. MMWR Surveill Summ. 2012;61:1–19. - PubMed
-
- Baron-Cohen S, Wheelwright S, Skinner R, Martin J, Clubley E. The autism-spectrum quotient (AQ): evidence from Asperger syndrome/high-functioning autism, males and females, scientists and mathematicians. J Autism Dev Disord. 2001;31:5–17. - PubMed
Publication types
MeSH terms
Grants and funding
- MH084164/MH/NIMH NIH HHS/United States
- K01MH092288/MH/NIMH NIH HHS/United States
- HD059205/HD/NICHD NIH HHS/United States
- DC0111095/DC/NIDCD NIH HHS/United States
- HD047520/HD/NICHD NIH HHS/United States
- R21 DC011095/DC/NIDCD NIH HHS/United States
- R01 HD059205/HD/NICHD NIH HHS/United States
- P30 HD040677/HD/NICHD NIH HHS/United States
- R01 HD047520/HD/NICHD NIH HHS/United States
- K01 MH092288/MH/NIMH NIH HHS/United States
- K23 MH086111/MH/NIMH NIH HHS/United States
- R01 MH084961/MH/NIMH NIH HHS/United States
- K23MH086111/MH/NIMH NIH HHS/United States
- R01 MH084164/MH/NIMH NIH HHS/United States
- MH084961/MH/NIMH NIH HHS/United States
- P30HD40677/HD/NICHD NIH HHS/United States
LinkOut - more resources
Full Text Sources
Other Literature Sources
