. 2013 Nov 27;5(4):1132-41.
doi: 10.1016/j.celrep.2013.10.014. Epub 2013 Nov 7.

High-resolution replication profiles define the stochastic nature of genome replication initiation and termination

Affiliations

High-resolution replication profiles define the stochastic nature of genome replication initiation and termination

Michelle Hawkins et al. Cell Rep. .

Abstract

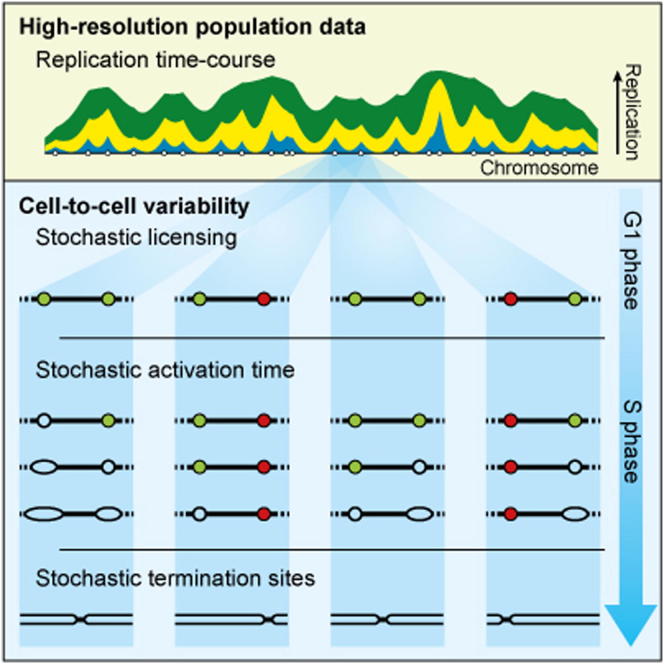
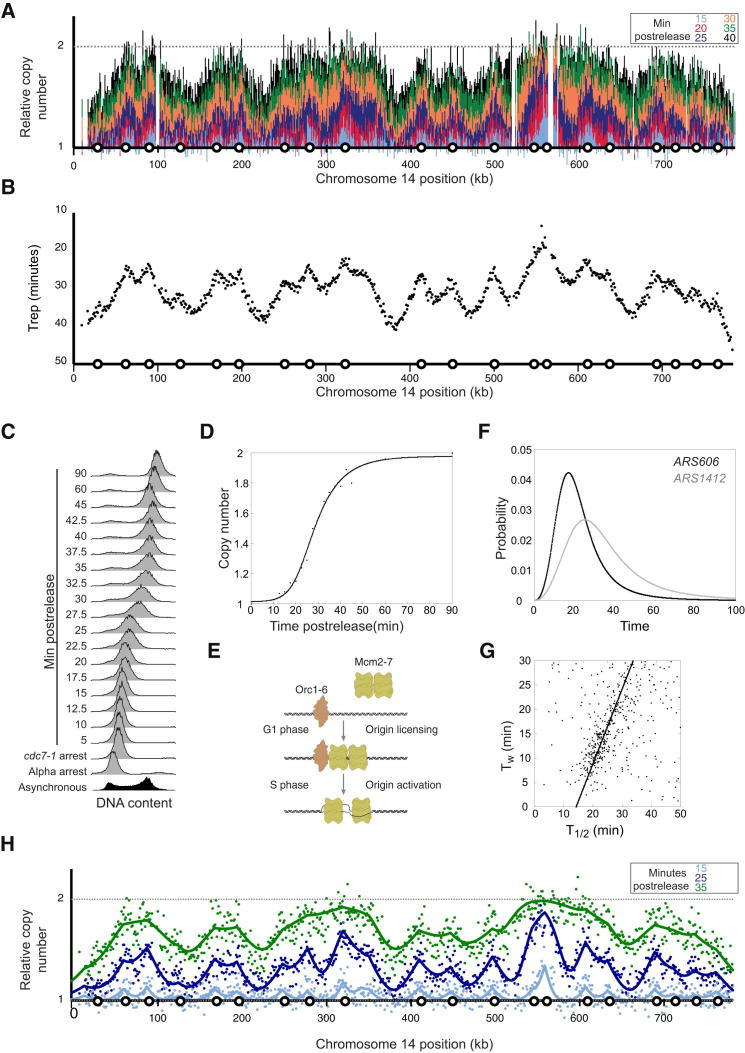
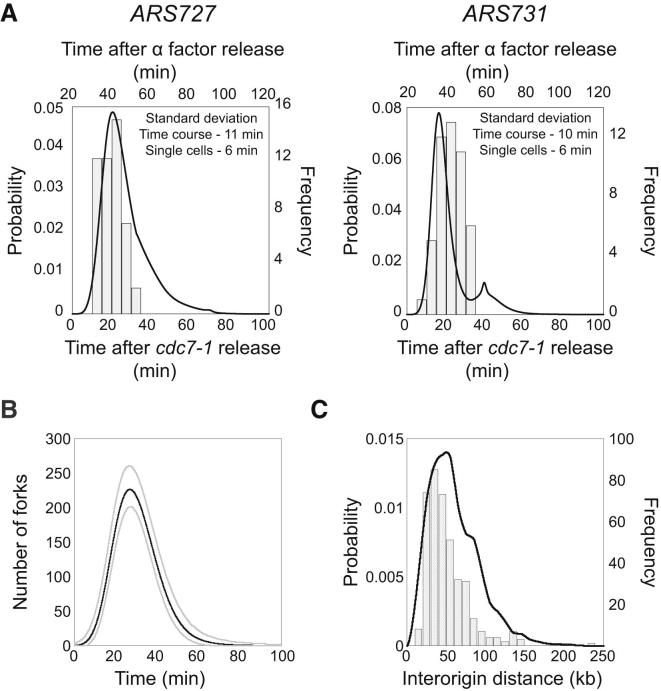
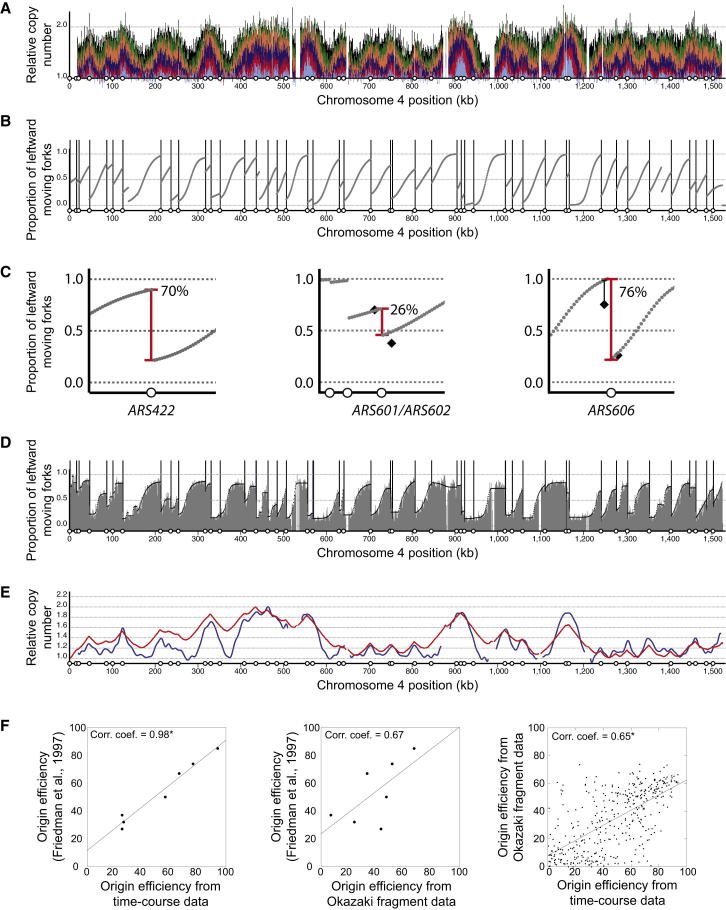
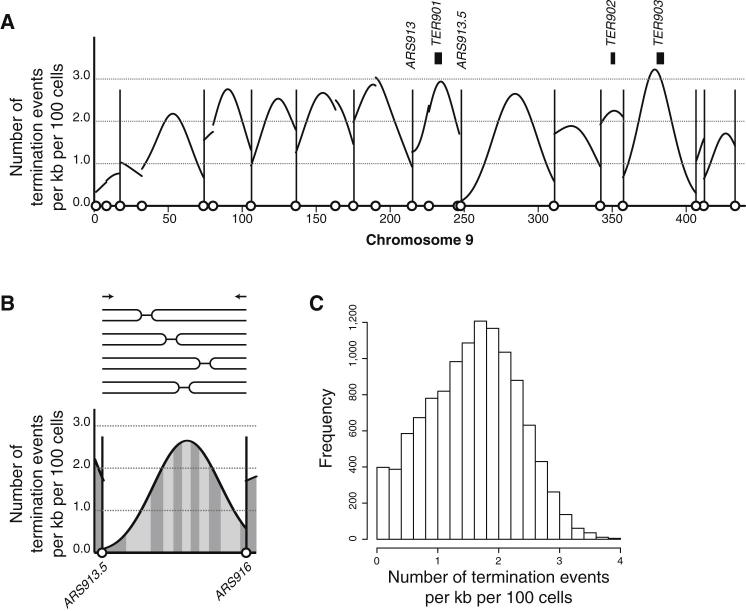
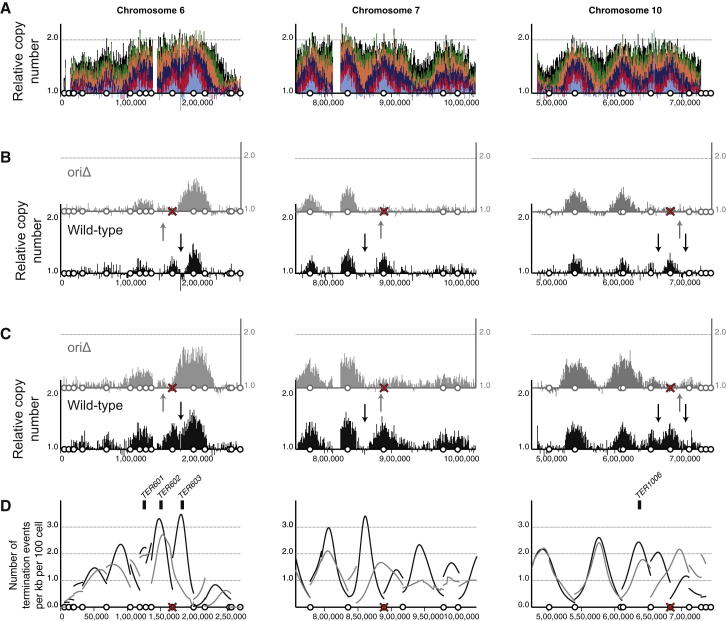
Eukaryotic genome replication is stochastic, and each cell uses a different cohort of replication origins. We demonstrate that interpreting high-resolution Saccharomyces cerevisiae genome replication data with a mathematical model allows quantification of the stochastic nature of genome replication, including the efficiency of each origin and the distribution of termination events. Single-cell measurements support the inferred values for stochastic origin activation time. A strain, in which three origins were inactivated, confirmed that the distribution of termination events is primarily dictated by the stochastic activation time of origins. Cell-to-cell variability in origin activity ensures that termination events are widely distributed across virtually the whole genome. We propose that the heterogeneity in origin usage contributes to genome stability by limiting potentially deleterious events from accumulating at particular loci.


Figures

None
Graphical abstract
Figure 1
Figure 1
A High Spatial and Temporal Resolution View of Genome Replication (A) Replication profiles for chromosome 14. The six S phase time points (15, 20, 25, 30, 35, and 40 min) are relative to release from the cdc7-1 zero time point. Each data point represents the extent of DNA replication in a 1 kb window. Circles on the x axis represent the location of replication origins. (B) Median replication time, Trep, derived from the time-course data shown in (A). (C) Flow cytometry data for the time-course experiment (see also Figure S1). (D) Quantification of the flow cytometry data that were used to normalize the deep sequencing data presented in (A). (E) The two temporally separate stages of replication origin function, licensing and activation, that the mathematical model captures. (F) Representative origin activation probability curves for an early activating origin (ARS606) and a late activating origin (ARS1412; see also Table S1). (G) Median origin activation time correlates with the width of the activation distribution (see also Figure S2). (H) Model fit (continuous line) to experimental replication-time-course data (points) for three representative time points.
Figure 2
Figure 2
Origin Replication Time Is Stochastic (A) Replication time of ARS727 (left) and ARS731 (right) are shown as inferred from time-course data (continuous line; time relative to cdc7-1 release shown on lower x axis) and single-cell measurements (histogram; time relative to α factor release shown on upper x axis). Equivalent S phase time points for cdc7-1 and α factor release were determined by flow cytometry (data not shown). For the single-cell data, n = 48 (see also Figure S2C). (B) The mean number of replication forks during S phase (min. post-cdc7-1) inferred from the time-course data (gray lines represent the range covering 95% of the population). (C) Distance between active replication origins inferred from time-course data (continuous line; probability distribution) and from published DNA-combing data (histogram; Tuduri et al., 2010).
Figure 3
Figure 3
Genome-wide Replication Fork Direction and Origin Efficiency from Time-Course Data (A) Replication profile for chromosome 4 (as described for Figure 1A). (B) Proportion of leftward-moving forks across chromosome 4 inferred from replication-time-course data. Vertical lines mark the location of active origins, at each of which there is a sharp transition from leftward- to rightward-moving forks. (C) Proportion of leftward-moving forks for 50 kb regions centered on ARS422 (left), ARS601/ARS602 (center), and ARS606 (right). Red vertical lines indicate the magnitude of the transition from leftward- to rightward-moving forks and the efficiency of the origin. Black diamonds indicate the proportion of leftward-moving forks at four chromosome 6 locations as previously determined by fork-direction gels (Friedman et al., 1997); for the location to the left of ARS606, the value was determined to be >75% and origin activity was estimated to be 74%. (D) Proportion of leftward-moving forks across chromosome 4 derived from mapping Okazaki fragments. Grey shading indicates the raw data with a fitted curve shown in black (origin locations are marked as in [B]; Smith and Whitehouse, 2012). (E) Replication time expressed as relative copy number derived from Okazaki fragment data (red; Smith and Whitehouse, 2012) or directly by deep sequencing (blue; Müller and Nieduszynski, 2012). (F) Pairwise comparisons of origin efficiency determined from the time-course data, from fork-direction gels (Friedman et al., 1997), and from mapping Okazaki fragments (Smith and Whitehouse, 2012). Pearson correlation coefficients are given (p < 0.0001).
Figure 4
Figure 4
Replication Termination Events Are Dispersed Across the Genome (A) The distribution of replication termination events across chromosome 9 inferred from replication-time-course data. Replication origins are marked as in Figure 3B with two origins discussed in the main text labeled; previously described termination sites are marked (Fachinetti et al., 2010). Genome-wide data are shown in Figure S3. (B) Termination events between ARS913.5 and ARS916 are shown using exemplars above the inferred distribution. Alternately shaded areas each have an equal probability of a termination event (one termination event in every ten cells). (C) The genome-wide frequency distribution for the probability of termination events per kb per 100 cells.
Figure 5
Figure 5
Inactivation of Replication Origins Results in Redistribution of Termination Events (A) Replication profile for chromosome 6 and regions of chromosomes 7 and 10 (as described for Figure 1A). (B and C) Comparisons of equivalent time points from the wild-type (black data) and origin mutant (gray data) are shown for each chromosomal region. Time points were selected to ensure equivalent levels of genome-wide DNA synthesis; time points are 15 and 20 min (wild-type) and 20 and 25 min (origin mutant) in (B) and (C), respectively. Vertical arrows indicate the inferred location of the highest probability termination sites. (D) The inferred distribution of replication termination sites for the wild-type (black) and the origin mutant (gray). Data displayed as in Figure 4A. A red cross marks origins that were inactivated in the mutant strain (see also Figures S4 and S5).

References

    1. Agier N., Fischer G. The mutational profile of the yeast genome is shaped by replication. Mol. Biol. Evol. 2012;29:905–913. - PubMed
    1. Azvolinsky A., Giresi P.G., Lieb J.D., Zakian V.A. Highly transcribed RNA polymerase II genes are impediments to replication fork progression in Saccharomyces cerevisiae. Mol. Cell. 2009;34:722–734. - PMC - PubMed
    1. Baker A., Audit B., Chen C.L., Moindrot B., Leleu A., Guilbaud G., Rappailles A., Vaillant C., Goldar A., Mongelard F. Replication fork polarity gradients revealed by megabase-sized U-shaped replication timing domains in human cell lines. PLoS Comput. Biol. 2012;8:e1002443. - PMC - PubMed
    1. Bechhoefer J., Rhind N. Replication timing and its emergence from stochastic processes. Trends Genet. 2012;28:374–381. - PMC - PubMed
    1. Blow J.J., Ge X.Q., Jackson D.A. How dormant origins promote complete genome replication. Trends Biochem. Sci. 2011;36:405–414. - PMC - PubMed

Publication types

Associated data