Comparative Study
. 2014 Jan;16(1):75-88.
doi: 10.1016/j.jmoldx.2013.09.003. Epub 2013 Nov 5.

Performance of common analysis methods for detecting low-frequency single nucleotide variants in targeted next-generation sequence data

Affiliations
Comparative Study

Performance of common analysis methods for detecting low-frequency single nucleotide variants in targeted next-generation sequence data

David H Spencer et al. J Mol Diagn. 2014 Jan.

Abstract

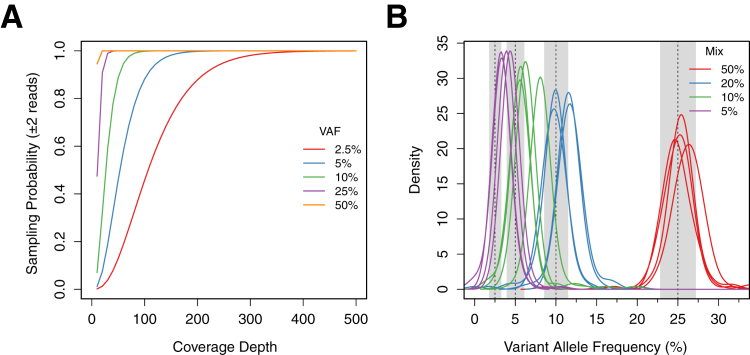
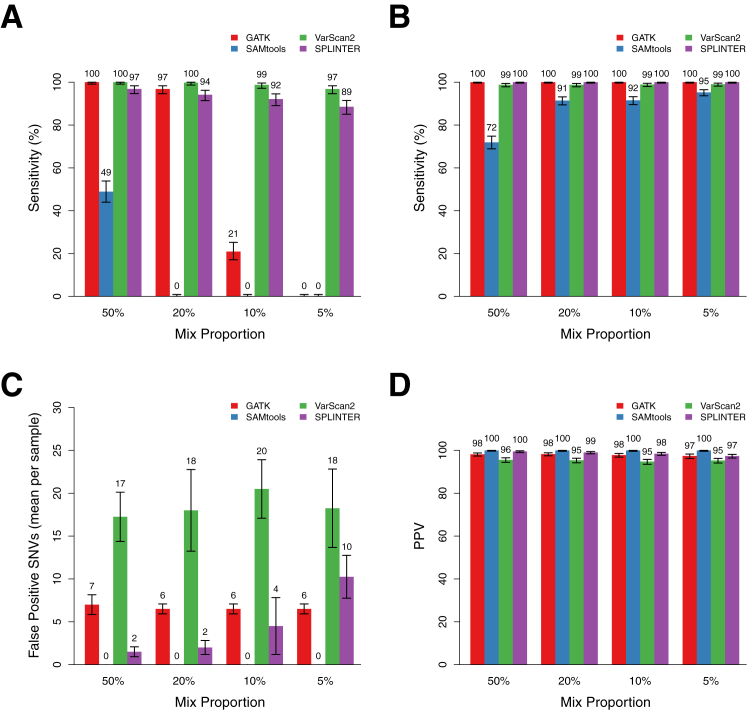
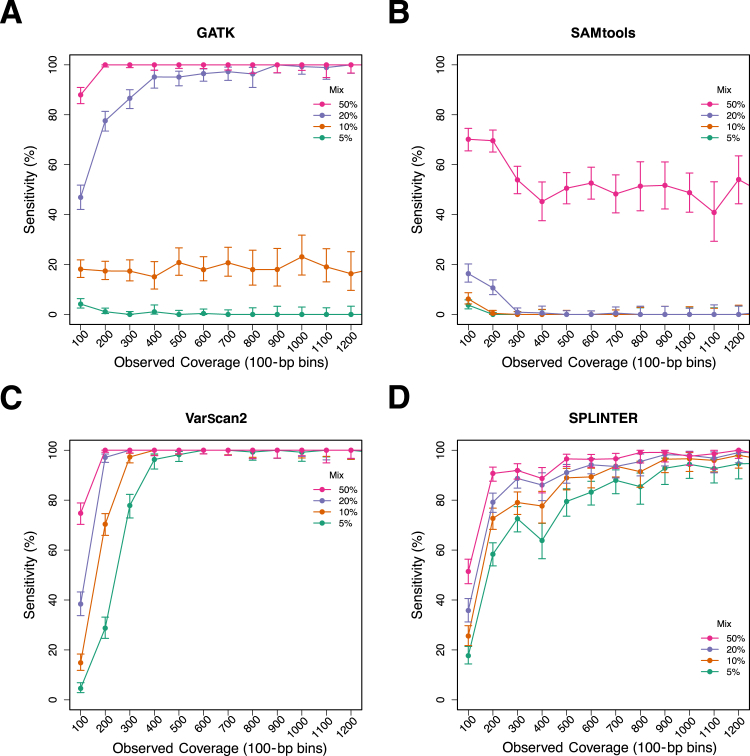
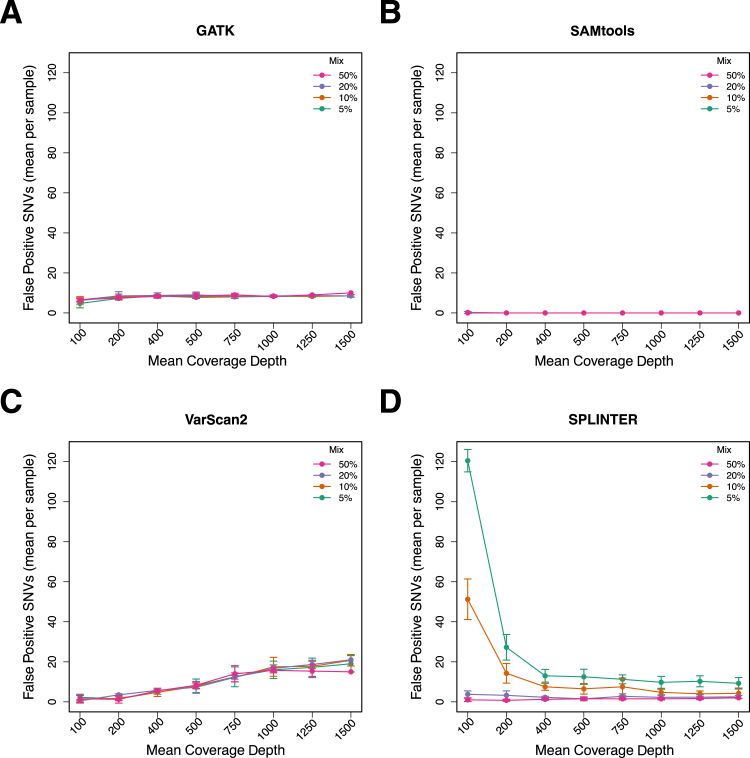
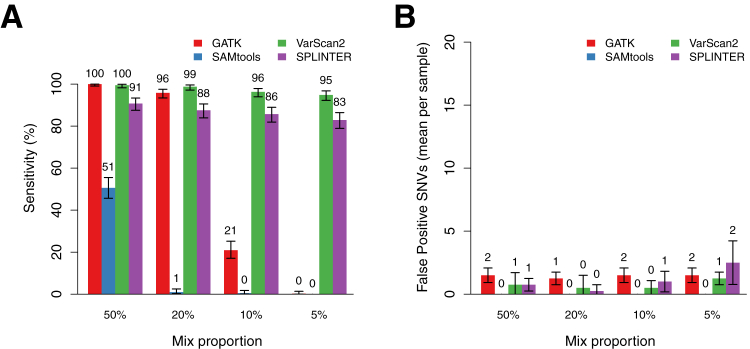
Next-generation sequencing (NGS) is becoming a common approach for clinical testing of oncology specimens for mutations in cancer genes. Unlike inherited variants, cancer mutations may occur at low frequencies because of contamination from normal cells or tumor heterogeneity and can therefore be challenging to detect using common NGS analysis tools, which are often designed for constitutional genomic studies. We generated high-coverage (>1000×) NGS data from synthetic DNA mixtures with variant allele fractions (VAFs) of 25% to 2.5% to assess the performance of four variant callers, SAMtools, Genome Analysis Toolkit, VarScan2, and SPLINTER, in detecting low-frequency variants. SAMtools had the lowest sensitivity and detected only 49% of variants with VAFs of approximately 25%; whereas the Genome Analysis Toolkit, VarScan2, and SPLINTER detected at least 94% of variants with VAFs of approximately 10%. VarScan2 and SPLINTER achieved sensitivities of 97% and 89%, respectively, for variants with observed VAFs of 1% to 8%, with >98% sensitivity and >99% positive predictive value in coding regions. Coverage analysis demonstrated that >500× coverage was required for optimal performance. The specificity of SPLINTER improved with higher coverage, whereas VarScan2 yielded more false positive results at high coverage levels, although this effect was abrogated by removing low-quality reads before variant identification. Finally, we demonstrate the utility of high-sensitivity variant callers with data from 15 clinical lung cancers.


Figures

Figure 1
Figure 1
A: Theoretical probability of sampling variant alleles of differing frequencies (25%, 10%, 5%, and 2.5%) two or more times versus coverage depth, based on binominal sampling statistics. B: Distribution of observed minor gold standard VAFs for all mixed samples. Each curve represents the distribution for a single sample with mixture proportions of 50%, 20%, 10%, and 5%, which were expected to have VAFs of 25%, 10%, 5%, and 2.5%, respectively. Gray bars show the middle 95% for each expected distribution.
Figure 2
Figure 2
Performance of GATK, SAMtools, VarScan2, and SPLINTER for detecting low-frequency variants in mixed samples at positions with coverage ≥100×. A: Sensitivity for detecting all heterozygous minor gold standard variants in samples with mix proportions of 50%, 20%, 10%, and 5% (mean observed gold standard VAFs, 25.5%, 11.2%, 6.8%, and 4.2%, respectively). Sensitivities (True positive/True positive + False negative) are point estimates based on detection of all minor gold standard variants at positions with ≥100× coverage in each set of mixed samples (n = 409, 406, 409, and 411, respectively). Error bars show the 95% binomial CI for each point estimate. B: Sensitivity for detecting homozygous and heterozygous gold standard variants in the major sample, which have estimated VAFs of >25%. Error bars show the 95% binomial CI for each point estimate. C: Mean number of false positive SNV calls per sample made by each program at the indicated mix proportion across the entire target region, encompassing coding and noncoding sequence of 26 genes (306,336 bp). Indel calls were excluded, as were positions with low coverage or discordant calls in the gold standard variant analysis (see Materials and Methods). Error bars show the SD across all samples with the indicated mix proportion (n = 4 for each mix proportion). D: PPV (True positive/True positive + False positive) for SNV calls by each program across the mix proportions. Error bars show the 95% binomial CI for each point estimate.
Figure 3
Figure 3
Sensitivity of GATK, SAMtools, VarScan2, and SPLINTER for low-frequency variants as a function of observed coverage at variant positions. Sequencing reads from mixed samples were randomly sampled (see Materials and Methods) to obtain datasets with estimated mean coverage depths of 1500, 1250, 1000, 750, 500, 400, 200, and 100 across the entire target region for each of the mixed samples. The observed coverage depths were determined for all minor gold standard variants, and variant detection was performed using each of the four programs. Panels show the overall sensitivity for all variants from each mixed sample in the observed coverage in bins of 100 (eg, the 100 bin contains all gold standard variants with coverage depths between 0 and 100) for GATK (A), SAMtools (B), VarScan2 (C), and SPLINTER (D). Error bars show the 95% binomial CI for each point estimate.
Figure 4
Figure 4
False positives (mean per sample) called by GATK, SAMtools, VarScan2, and SPLINTER as a function of mean target coverage and mix proportion across the entire target region encompassing coding and noncoding sequences of 26 genes (306,336 bp). Variant SNV calls in down-sampled data that were not among the gold standard SNVs were called as false positive, after excluding indel calls and positions that were low coverage (<50) or discordant in the gold standard analysis. The number of false positive calls for GATK (A), SAMtools (B), VarScan2 (C), and SPLINTER (D) for each down-sampled coverage level and the mix proportion indicated by the legend. Error bars show the SD for each coverage level and mix proportion.
Figure 5
Figure 5
Sensitivity and false positive calls made using only filtered reads compared with using all reads. Filtered reads included only those with a mapping quality >20, a minimum base quality of 20 for all bases, and no more than four discrepancies. A: Sensitivity for minor gold standard SNVs across all four programs after filtering of low-quality and multiple-discrepancy reads. Error bars show the 95% binomial CI for each point estimate. B: False positive SNV calls (mean per sample) using high-quality reads compared with all reads. Error bars show the SD across all samples at each mix proportion (n = 4).

References

    1. Druker B.J., Talpaz M., Resta D.J., Peng B., Buchdunger E., Ford J.M., Lydon N.B., Kantarjian H., Capdeville R., Ohno-Jones S., Sawyers C.L. Efficacy and safety of a specific inhibitor of the BCR-ABL tyrosine kinase in chronic myeloid leukemia. N Engl J Med. 2001;344:1031–1037. - PubMed
    1. Kohl T.M., Schnittger S., Ellwart J.W., Hiddemann W., Spiekermann K. KIT exon 8 mutations associated with core-binding factor (CBF)-acute myeloid leukemia (AML) cause hyperactivation of the receptor in response to stem cell factor. Blood. 2005;105:3319–3321. - PubMed
    1. Kottaridis P.D., Gale R.E., Frew M.E., Harrison G., Langabeer S.E., Belton A.A., Walker H., Wheatley K., Bowen D.T., Burnett A.K., Goldstone A.H., Linch D.C. The presence of a FLT3 internal tandem duplication in patients with acute myeloid leukemia (AML) adds important prognostic information to cytogenetic risk group and response to the first cycle of chemotherapy: analysis of 854 patients from the United Kingdom Medical Research Council AML 10 and 12 trials. Blood. 2001;98:1752–1759. - PubMed
    1. Ley T.J., Ding L., Walter M.J., McLellan M.D., Lamprecht T., Larson D.E. DNMT3A mutations in acute myeloid leukemia. N Engl J Med. 2010;363:2424–2433. - PMC - PubMed
    1. Lièvre A., Bachet J.B., Le Corre D., Boige V., Landi B., Emile J.F., Côté J.F., Tomasic G., Penna C., Ducreux M., Rougier P., Penault-Llorca F., Laurent-Puig P. KRAS mutation status is predictive of response to cetuximab therapy in colorectal cancer. Cancer Res. 2006;66:3992–3995. - PubMed

Publication types

MeSH terms