

Validation of a next-generation sequencing assay for clinical molecular oncology
- PMID: 24211365
- PMCID: PMC5762937
- DOI: 10.1016/j.jmoldx.2013.10.002
Validation of a next-generation sequencing assay for clinical molecular oncology
Abstract
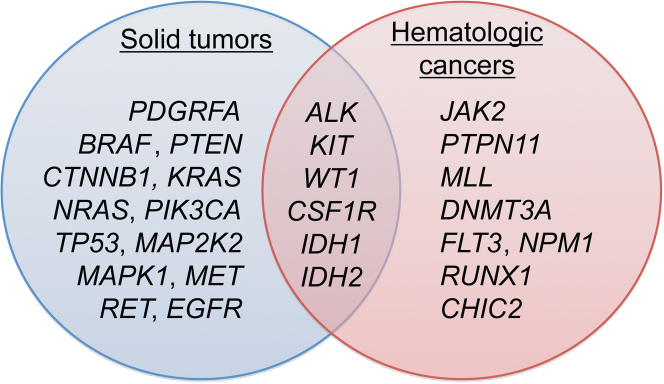
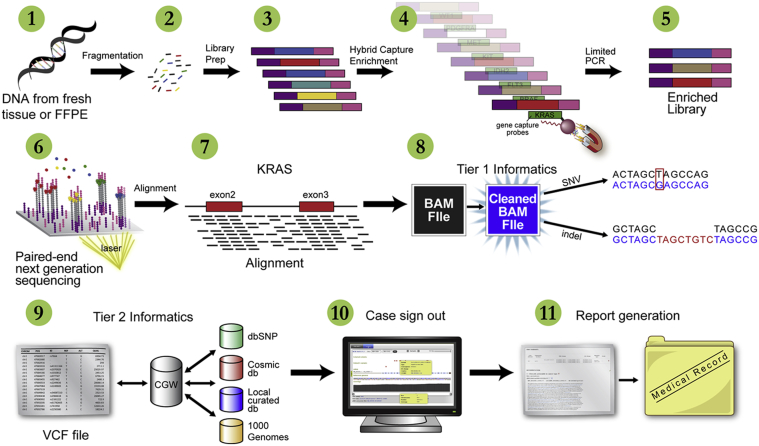
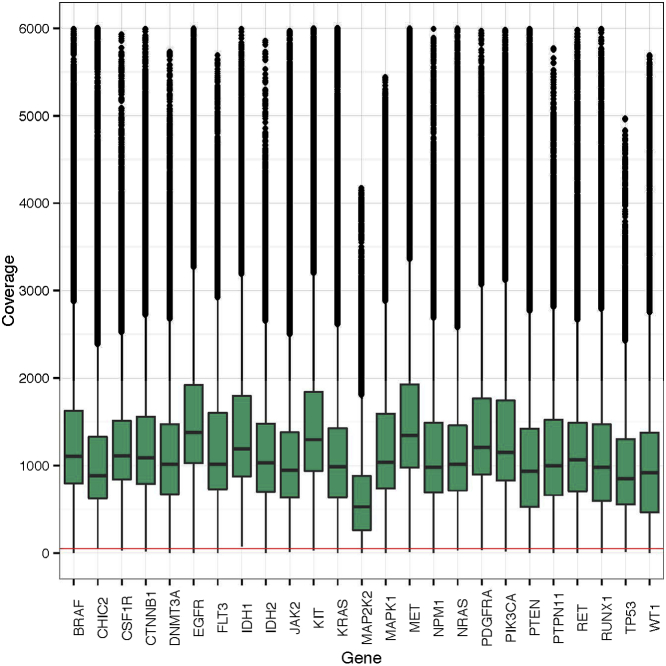
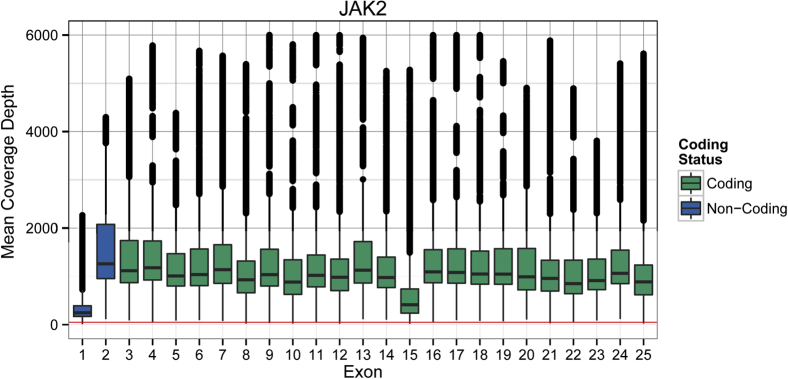
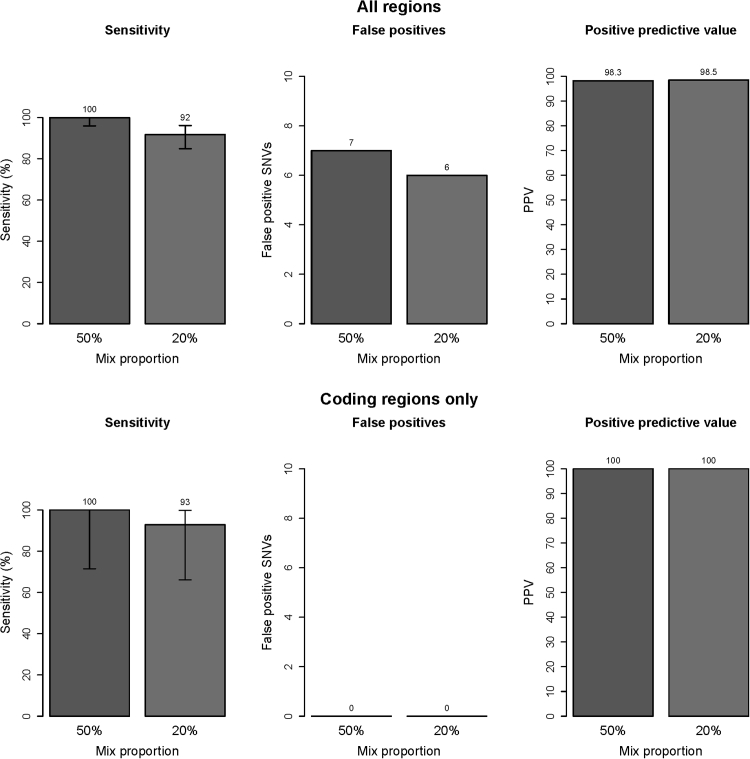
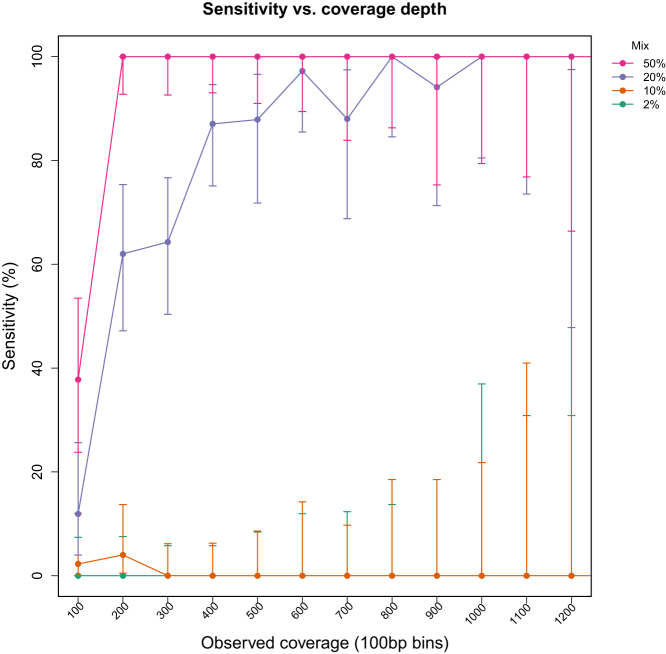
Currently, oncology testing includes molecular studies and cytogenetic analysis to detect genetic aberrations of clinical significance. Next-generation sequencing (NGS) allows rapid analysis of multiple genes for clinically actionable somatic variants. The WUCaMP assay uses targeted capture for NGS analysis of 25 cancer-associated genes to detect mutations at actionable loci. We present clinical validation of the assay and a detailed framework for design and validation of similar clinical assays. Deep sequencing of 78 tumor specimens (≥ 1000× average unique coverage across the capture region) achieved high sensitivity for detecting somatic variants at low allele fraction (AF). Validation revealed sensitivities and specificities of 100% for detection of single-nucleotide variants (SNVs) within coding regions, compared with SNP array sequence data (95% CI = 83.4-100.0 for sensitivity and 94.2-100.0 for specificity) or whole-genome sequencing (95% CI = 89.1-100.0 for sensitivity and 99.9-100.0 for specificity) of HapMap samples. Sensitivity for detecting variants at an observed 10% AF was 100% (95% CI = 93.2-100.0) in HapMap mixes. Analysis of 15 masked specimens harboring clinically reported variants yielded concordant calls for 13/13 variants at AF of ≥ 15%. The WUCaMP assay is a robust and sensitive method to detect somatic variants of clinical significance in molecular oncology laboratories, with reduced time and cost of genetic analysis allowing for strategic patient management.
Copyright © 2014 American Society for Investigative Pathology and the Association for Molecular Pathology. Published by Elsevier Inc. All rights reserved.
Figures

Comment in
-
Genomic technologies and the new era of genomic medicine.J Mol Diagn. 2014 Jan;16(1):7-10. doi: 10.1016/j.jmoldx.2013.11.001. Epub 2013 Nov 21. J Mol Diagn. 2014. PMID: 24269227 No abstract available.
References
-
- Walter M.J., Shen D., Ding L., Shao J., Koboldt D.C., Chen K., Larson D.E., McLellan M.D., Dooling D., Abbott R., Fulton R., Magrini V., Schmidt H., Kalicki-Veizer J., O’Laughlin M., Fan X., Grillot M., Witowski S., Heath S., Frater J.L., Eades W., Tomasson M., Westervelt P., DiPersio J.F., Link D.C., Mardis E.R., Ley T.J., Wilson R.K., Graubert T.A. Clonal architecture of secondary acute myeloid leukemia. N Engl J Med. 2012;366:1090–1098. - PMC - PubMed
-
- Patel J.P., Gönen M., Figueroa M.E., Fernandez H., Sun Z., Racevskis J., Van Vlierberghe P., Dolgalev I., Thomas S., Aminova O., Huberman K., Cheng J., Viale A., Socci N.D., Heguy A., Cherry A., Vance G., Higgins R.R., Ketterling R.P., Gallagher R.E., Litzow M., van den Brink M.R., Lazarus H.M., Rowe J.M., Luger S., Ferrando A., Paietta E., Tallman M.S., Melnick A., Abdel-Wahab O., Levine R.L. Prognostic relevance of integrated genetic profiling in acute myeloid leukemia. N Engl J Med. 2012;366:1079–1089. - PMC - PubMed
-
- Kalari K.R., Rossell D., Necela B.M., Asmann Y.W., Nair A., Baheti S., Kachergus J.M., Younkin C.S., Baker T., Carr J.M., Tang X., Walsh M.P., Chai H.S., Sun Z., Hart S.N., Leontovich A.A., Hossain A., Kocher J.P., Perez E.A., Reisman D.N., Fields A.P., Thompson E.A. Deep sequence analysis of non-small cell lung cancer: integrated analysis of gene expression, alternative splicing, and single nucleotide variations in lung adenocarcinomas with and without oncogenic KRAS mutations. Front Oncol. 2012;2:12. - PMC - PubMed
-
- Chen J., Huang X.F., Katsifis A. Activation of signal pathways and the resistance to anti-EGFR treatment in colorectal cancer. J Cell Biochem. 2010;111:1082–1086. - PubMed
-
- Duncavage E.J., Abel H.J., Szankasi P., Kelley T.W., Pfeifer J.D. Targeted next generation sequencing of clinically significant gene mutations and translocations in leukemia. Mod Pathol. 2012;25:795–804. - PubMed
Publication types
MeSH terms
Substances
LinkOut - more resources
Full Text Sources
Other Literature Sources
