. 2013 Nov 11:3:3178.
doi: 10.1038/srep03178.

Analyses of interactions between heparin and the apical surface proteins of Plasmodium falciparum

Affiliations

Analyses of interactions between heparin and the apical surface proteins of Plasmodium falciparum

Kyousuke Kobayashi et al. Sci Rep. .

Erratum in

  • Sci Rep. 2014;4:4349

Abstract

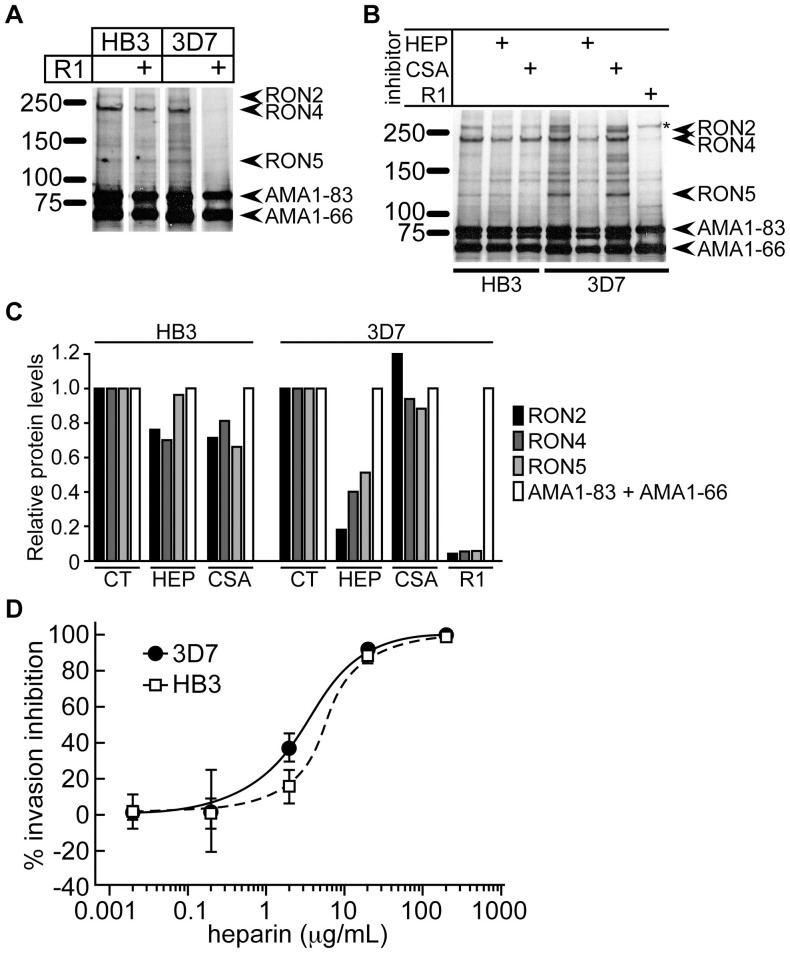
Heparin, a sulfated glycoconjugate, reportedly inhibits the blood-stage growth of the malaria parasite Plasmodium falciparum. Elucidation of the inhibitory mechanism is valuable for developing novel invasion-blocking treatments based on heparin. Merozoite surface protein 1 has been reported as a candidate target of heparin; however, to better understand the molecular mechanisms involved, we characterized the molecules that bind to heparin during merozoite invasion. Here, we show that heparin binds only at the apical tip of the merozoite surface and that multiple heparin-binding proteins localize preferentially in the apical organelles. To identify heparin-binding proteins, parasite proteins were fractionated by means of heparin affinity chromatography and subjected to immunoblot analysis with ligand-specific antibodies. All tested members of the Duffy and reticulocyte binding-like families bound to heparin with diverse affinities. These findings suggest that heparin masks the apical surface of merozoites and blocks interaction with the erythrocyte membrane after initial attachment.


Figures

Figure 1
Figure 1. The binding of heparin to the erythrocyte surface does not inhibit merozoite invasion.
Three microliters of packed erythrocytes were mixed with CM in the absence or presence of 230 μg/mL heparin and incubated at 37°C overnight. The erythrocytes were washed 0–3 times before being used for the invasion assays. The invasion rates were calculated by dividing the parasitemia of the test cultures by that of the cultures that lacked heparin. The results are shown as the means of three independent experiments, and the error bars represent standard errors. The asterisk (*) indicates significant differences (p < 0.05) as determined by t-tests.
Figure 2
Figure 2. Merozoites bind to heparin-agarose beads.
(A) Heparin-agarose beads were incubated with a GFP-expressing parasite culture in the late schizont stage until the number of egressing merozoites increased. The beads separated from erythrocytes were washed, fixed, and stained with DAPI (nuclei). In this panel, differential interference contrast (DIC) images, fluorescent signals of the parasite nuclei and GFP, and the merged signals are shown. (B) During incubation of the beads with parasite cultures, 10 mg/mL soluble heparin (HEP), CSA, or PBS (no inhibitor) was added. After being collected, washed, and fixed, the beads were stained with TO-PRO-3. In panels A and B, the white bars represent 5 μm.
Figure 3
Figure 3. Heparin-binding proteins localize predominantly at the apical ends of merozoites.
(A) The binding specificity of biotinylated heparin was verified. A parasite culture in the late schizont stage was smeared onto glass slides, fixed with methanol, and treated with a rabbit anti-EBA-175 antibody (red) and either unlabeled heparin (Hep) or biotinylated heparin (Biot-Hep; green). Signals were detected by using streptavidin–Alexa Fluor 488 and Alexa Fluor 633 secondary antibodies. The white bars represent 5 μm. (B) Invasion inhibitory activity of biotinylated heparin. Invasion inhibition assays were performed in the presence of 5 or 50 μg/mL CSA, biotinylated heparin (Biot-Hep), or unlabeled heparin (Hep). The percentages of invasion inhibition were calculated by dividing the parasitemia of the test cultures by that of the control cultures, multiplying the result by 100, and then subtracting the result from 100. The results are shown as the means of three independent experiments; the error bars represent standard errors. (C) Binding between heparin and merozoite surfaces. Parasite cultures at the late schizont stage were cultured with 50 μg/mL biotinylated heparin in the absence (grey) or presence of 1 mg/mL heparin (green line) or CSA (red line) for 1 h. Free merozoites were isolated from the culture supernatant, stained with fluorescent streptavidin, and analyzed by flow cytometry. The dashed line shows untreated merozoites. (D) The heparin binding site on the merozoite surface. Biotinylated heparin was incubated with a parasite culture at the late schizont stage. When the number of egressing merozoites increased, the culture was fixed and stained with an antibody against EBA-175 (apical end) or MSP1–19 (surface). The biotinylated heparin and the antibody on the parasite surface were visualized by using fluorescent-labeled streptavidin or secondary antibodies. (E) Localization of heparin-binding proteins in merozoites. The localization of heparin-binding proteins was compared with EBA-175 (microneme and apical end), MSP1–19 (surface), or nuclei by immunofluorescent staining using biotinylated heparin, specific antibodies, and TO-PRO-3. (D), (E) The fluorescent signals of the marker proteins and heparin (hep), DIC images, merged fluorescent signals, and a schematic for their localization are shown. M, micronemes; R, rhoptries; N, nuclei.
Figure 4
Figure 4. Erythrocyte-binding proteins of parasites bind to heparin-agarose beads.
(A) Pull-down assays of radiolabeled culture supernatants of P. falciparum using heparin-agarose (HEP), glutathione-Sepharose (GLU), Ni-NTA–agarose, or protein G-Sepharose beads. (B) Erythrocyte-binding assays of radiolabeled culture supernatants, which were pre-adsorbed to heparin-agarose (HEP) or glutathione-Sepharose (GLU) beads or were not pre-adsorbed (NT). Proteins that bound to the beads or erythrocytes were eluted and analyzed by means of autoradiography. The molecular masses (kDa) are indicated on the left.
Figure 5
Figure 5. Affinity chromatography of schizont proteins on a heparin column.
(A) The elution profile of heparin-binding proteins of the P. falciparum HB3 clone. A schizont lysate was diluted with the binding buffer and separated by affinity chromatography on a heparin column. The proteins were washed and eluted from the column with a stepwise gradient of NaCl (0.2–1.5 M; thin line). Flow-through fractions of the lysate (FT), the wash buffer (wash), and the elution buffer (eluate) were collected (1.0 mL each) and subjected to protein quantification (thick line). (B) The eluate fractions containing proteins (E2–12) were analyzed by use of SDS-PAGE and silver staining. The molecular masses (kDa) are indicated on the right. (C) Eight fractions (FT and E3–9) were analyzed by immunoblotting. The arrowheads indicate specific bands. The molecular masses (kDa) are indicated on the left.
Figure 6
Figure 6. Elution of parasite proteins bound to the heparin column by soluble heparin or other sulfated compounds.
(A) Parasite proteins eluted by soluble competitors (heparin, HDS, or CSA) were electrophoresed on SDS-PAGE and subjected to silver staining. Parasite proteins capable of binding to the heparin column were separated from a schizont lysate by using a HiTrap Heparin HP column with a bed volume of 1 mL, washed with 10 mL of wash buffer, and eluted by 1 mL of increasing concentrations of the soluble competitors. After the competitive elution at the maximum concentration of 10 mg/mL, the remaining proteins in the column were eluted with 2 M NaCl. Flow-through fractions of the lysate (FT), proteins eluted by the wash buffer (wash), by the soluble competitors, or by 2 M NaCl were electrophoresed on SDS-PAGE and subjected to silver staining. The names of the competitors used for the elution are indicated on the right. The molecular masses (kDa) are indicated on the left. (B) The protein amount eluted by the competitors or NaCl was estimated by quantitative densitometry of the silver-stained gel using Image J software (ver. 1.45 s), because heparin in the eluted fractions interfered with the protein quantification by the Bradford method as used in Fig. 5. The ratios of eluted proteins (by either the competitors or 2 M NaCl) to total proteins bound to the column was calculated. (C), (D) An unbound fraction (FT) and bound/eluted fractions with heparin (C) or HDS (D) were analyzed by immunoblotting.
Figure 7
Figure 7. Clone-specific disruption of the AMA1/RONs complex by heparin contributes little to invasion inhibition.
(A), (B) Radiolabeled schizont lysates from the HB3 or 3D7 clones were immunoprecipitated with the 28G2 monoclonal antibody (anti-AMA1) in the presence or absence of 1 mg/mL heparin (HEP), CSA, or the R1 peptide, and then subjected to autoradiographic analysis. The arrowheads indicate the bands that correspond to each molecule. The bands corresponding to RON2 from the HB3 clone exhibited slower mobility on SDS-PAGE than did those from the 3D7 clone. The asterisk in panel B denotes a nonspecific band that did not appear consistently but did not disappear in the presence of the R1 peptide. The molecular masses (kDa) are indicated on the left. (C) Relative protein levels of each RON protein co-immunoprecipitated with AMA-1 in the absence or presence of heparin, CSA, or the R1 peptide. The optical densities of each band were measured with Image J software. Data are shown as the means of two independent experiments. (D) Invasion inhibitory activities of heparin against the P. falciparum HB3 and 3D7 clones. Invasion assays were performed in the presence of heparin at a final concentration of 0.02, 0.2, 2, 20, or 200 μg/mL. The percentages of invasion inhibition were calculated by dividing the parasitemia of the test cultures by that of the control cultures, multiplying the result by 100, and then subtracting the result from 100. The results are shown as the means of three independent experiments; the error bars represent standard deviations.

References

    1. World Health Organization. World malaria report: 2012 <www.who.int/malaria> (2012).
    1. Aikawa M., Miller L. H., Johnson J. & Rabbege J. Erythrocyte entry by malarial parasites. A moving junction between erythrocyte and parasite. J. Cell Biol. 77, 72–82 (1978). - PMC - PubMed
    1. Dvorak J. A., Miller L. H., Whitehouse W. C. & Shiroishi T. Invasion of erythrocytes by malaria merozoites. Science 187, 748–750 (1975). - PubMed
    1. Holder A. A. The carboxy-terminus of merozoite surface protein 1: structure, specific antibodies and immunity to malaria. Parasitology 136, 1445–1456 (2009). - PubMed
    1. Richard D. et al. Interaction between Plasmodium falciparum apical membrane antigen 1 and the rhoptry neck protein complex defines a key step in the erythrocyte invasion process of malaria parasites. J. Biol. Chem. 285, 14815–14822 (2010). - PMC - PubMed

Publication types

MeSH terms