. 2013 Nov;142(2):365-80.
doi: 10.1007/s10549-013-2738-0. Epub 2013 Nov 10.

Differential methylation relative to breast cancer subtype and matched normal tissue reveals distinct patterns

Affiliations

Differential methylation relative to breast cancer subtype and matched normal tissue reveals distinct patterns

Sabrina A Bardowell et al. Breast Cancer Res Treat. 2013 Nov.

Abstract

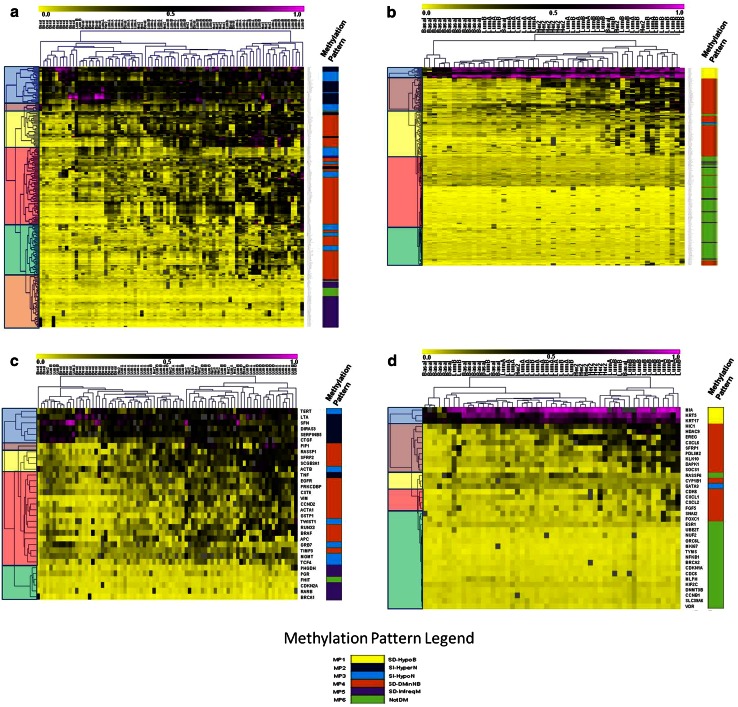
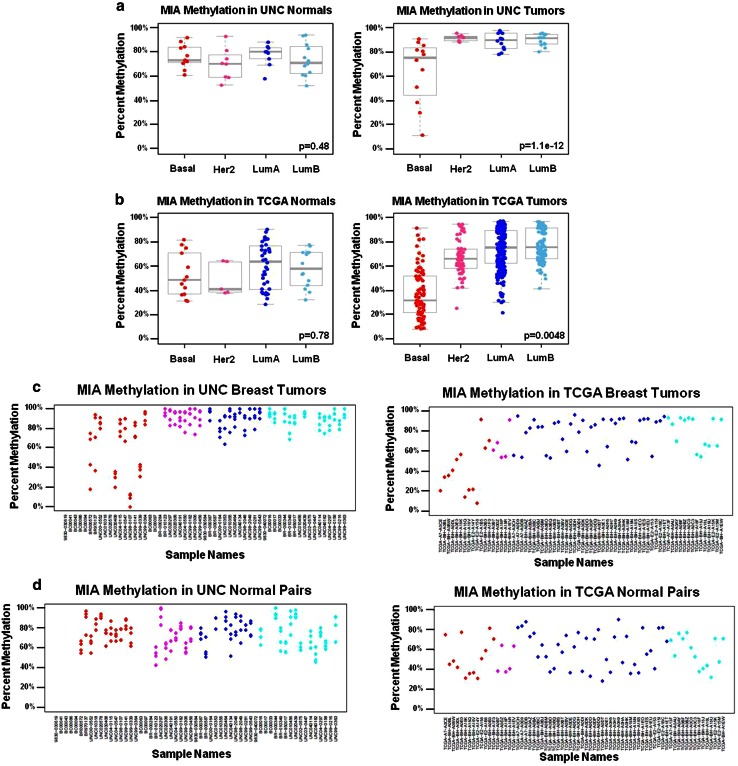
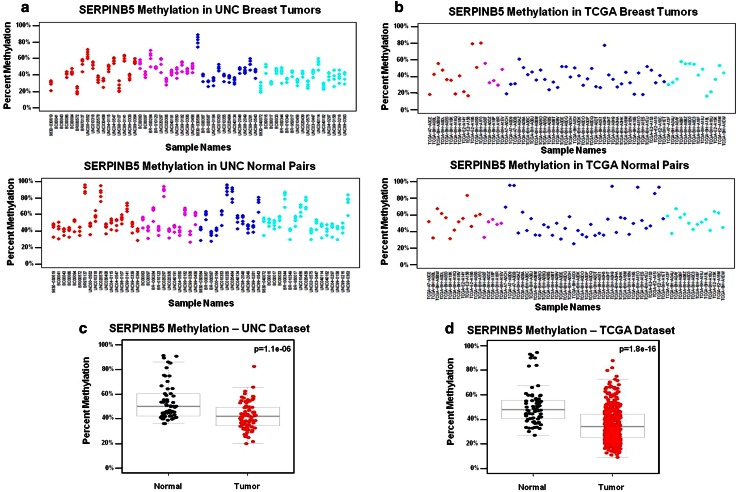
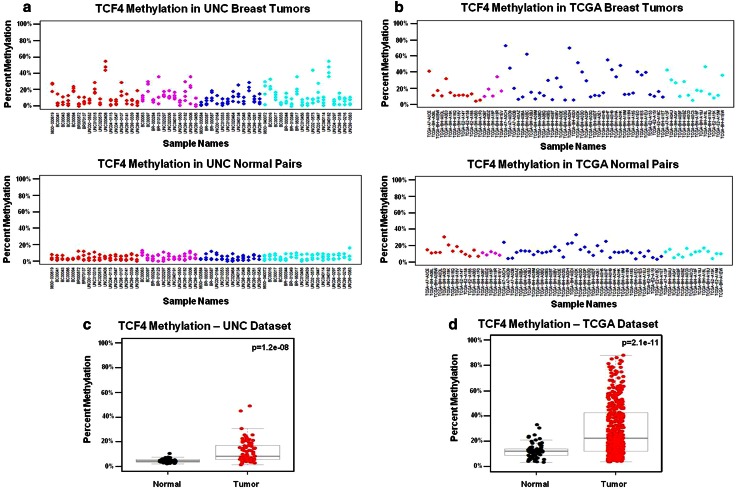
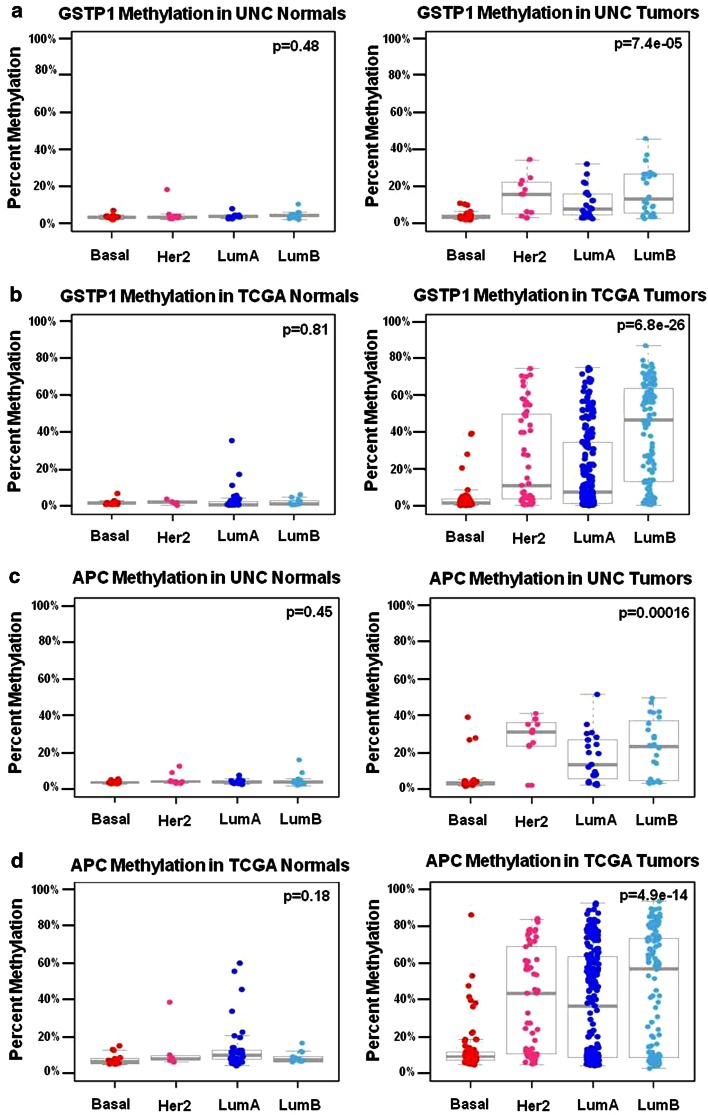
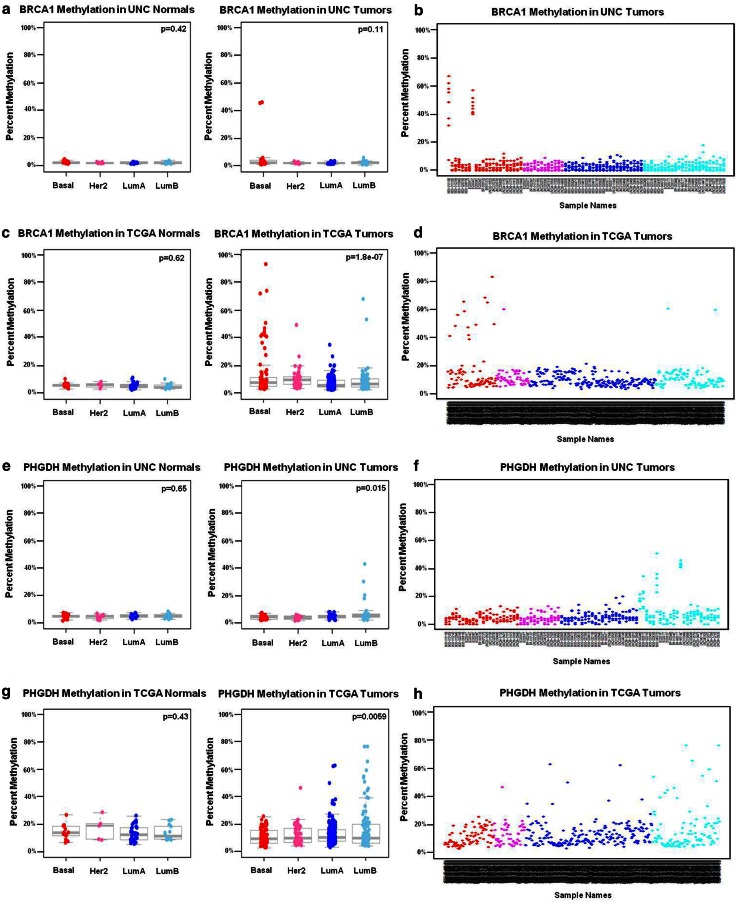
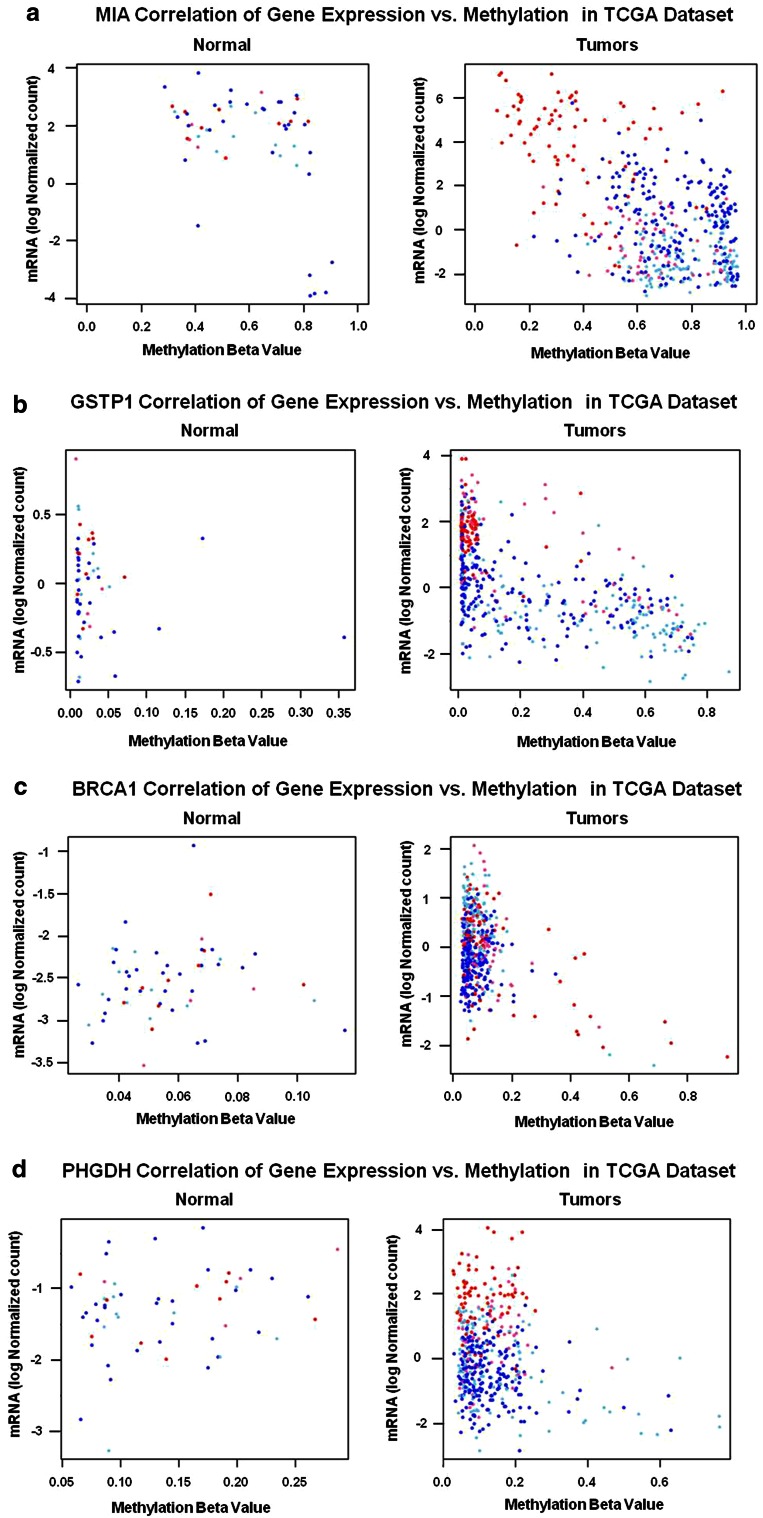
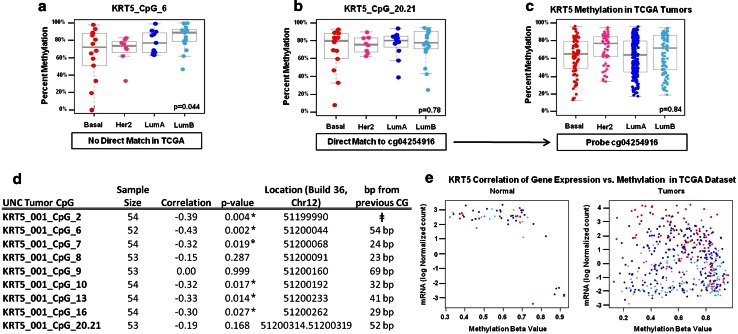
Due to the heterogeneous nature of breast cancer and the widespread use of single-gene studies, there is limited knowledge of multi-gene, locus-specific DNA methylation patterns in relation to molecular subtype and clinical features. We, therefore, quantified DNA methylation of 70 candidate gene loci in 140 breast tumors and matched normal tissues and determined associations with gene expression and tumor subtype. Using Sequenom's EpiTYPER platform, approximately 1,200 CpGs were interrogated and revealed six DNA methylation patterns in breast tumors relative to matched normal tissue. Differential methylation of several gene loci was observed within all molecular subtypes, while other patterns were subtype-dependent. Methylation of numerous gene loci was inversely correlated with gene expression, and in some cases, this correlation was only observed within specific breast tumor subtypes. Our findings were validated on a larger set of tumors and matched adjacent normal tissue from The Cancer Genome Atlas dataset, which utilized methylation data derived from both Illumina Infinium 27 and 450 k arrays. These findings highlight the need to control for subtype when interpreting DNA methylation results, and the importance of interrogating multiple CpGs across varied gene regions.


Figures

Fig. 1
Fig. 1
ad Unsupervised hierarchical clustering analysis of candidate loci methylation in UNC datasets identifies six methylation patterns. The clustergram is highlighted on the left to display the major clada for each dataset. The colored bar on the right of the clustergram displays the methylation pattern group for either each CpG unit or average methylation per gene (MP1 = yellow, MP2 = dark blue, MP3 = light blue, MP4 = orange, MP5 = purple, and MP6 = green). Hierarchical clustering analysis (HCA) by CpG unit of a 81 tumors and b 53 tumors reveal enrichment of methylation patterns for each cluster. HCA of averaged methylation per locus for c 81 tumors and 33 genes and d 53 tumors and 37 genes show similar clustering groups and methylation patterns compared to clustergrams based on individual CpG units. See online resource 3 for a detailed listing of rows (genes, CpG IDs) and columns (tumor subytpe)
Fig. 2
Fig. 2
ad MP1 gene loci display hypermethylation in normal tissue and all tumor subtypes with a subset of basal tumors displaying a hypomethylated phenotype. Box plots display percent methylation distributions in normal breast tissue and matched tumors (n = 57 matched pairs for the UNC dataset and n = 70 matched pairs for the TCGA dataset) where the upper and lower whiskers represent 1.5 times the interquartile range (IQR). Molecular subtype is listed on the horizontal axis and percent methylation on the vertical axis. Each dot represents the average percent methylation by MassARRAY across the amplicon for the UNC dataset, or for the β values of the closest MIA Illumina probe (cg25152942) in the TCGA dataset, respectively. Tumors are grouped by PAM50 molecular subtypes assigned from previous oligoarray analysis (Basal = red, HER2-enriched = pink, Luminal A = dark blue, and Luminal B = light blue), while normal tissues are grouped by the molecular subtype of the matched tumor. The MP1 “SD-HypoB” locus pattern was recapitulated in TCGA breast samples by t test of methylation differences between basal and non-basal tumors significant for tumors in both a the UNC dataset and b the TCGA dataset, while no significant difference was observed in matched normal tissue in either dataset. MIA methylation in c UNC breast tumors and matched normal tissue and d TCGA breast tumors and matched normal tissue are displayed in scatterplots. (Note: similar or overlapping percent methylation values for each CpG within an amplicon by MassARRAY will appear as one “dot” in the UNC scatterplots). T test p values for the basal vs. non-basal test are provided in the bottom right of each figure
Fig. 3
Fig. 3
ad MP2 gene loci display subtype-independent differential methylation pattern with tumors exhibiting lower methylation compared to normal tissue. SERPINB5 methylation in a UNC breast tumors and matched normal tissue and b TCGA breast tumors and matched normal tissue are displayed in scatterplots of individual CpG units in the UNC dataset, and by β values for matched SERPINB5 probe cg20837735. MP2 “SI-HyperN” gene loci display significantly lower average percent methylation in tumor samples vs. matched normal tissue in both the c UNC dataset and were recapitulated in d the TCGA dataset. T test p values for methylation differences between tumor vs. normal samples are provided in the top right of each box plot
Fig. 4
Fig. 4
ad MP3 gene loci display subtype-independent differential methylation with tumors exhibiting higher methylation compared to normal tissue. MP3 gene loci are distinguished from MP2 loci by relative hypomethylation in matched normal tissues, which are subtype-independent; e.g., “SI-HypoN.” TCF4 methylation patterns for a UNC breast tumors and matched normal tissue and b TCGA breast tumors and matched normal tissue are displayed in scatterplots of individual CpG units in the UNC dataset, and by β values for matched TCF4 Illumina probe cg08491964. MP3 “SI-HypoN” gene loci display significantly higher average percent methylation in tumors compared to matched normal tissue in both the c UNC dataset and d the TCGA datasets. T test p values for methylation differences between tumor vs. normal samples are provided in the top right of each box plot
Fig. 5
Fig. 5
ad MP4 gene loci display a hypomethylated phenotype in basal tumors and differential methylation in non-basal HER2, LumA, and LumB tumors. Box plots show percent methylation distributions in normal breast tissue and matched breast tumors. MP4, subtype-dependent, differentially methylated in non-basal tumors “SD-DMinNB” patterns were validated in the TCGA tumor and matched normal sample set. A significant difference by ANOVA was observed in average percent methylation of GSTP1 between molecular subtypes in both a the UNC tumor dataset and b the TCGA tumor dataset for the matched GSTP1 cg04920951 probe, while no significant difference was observed in matched normal tissue in either dataset. APC also demonstrated an MP4 methylation locus pattern, but unlike GSTP1, APC methylation was not associated with gene expression in either the c UNC or d TCGA dataset. (Boxplots shown are of averaged percent methylation across the MassARRAY amplicon in the UNC samples, and averaged β values for three matched APC probes; cg21634602, cg20311501, and cg16970232, respectively). ANOVA p values for testing methylation differences between molecular subtype are provided in the top right of each box plot
Fig. 6
Fig. 6
ah MP5 gene loci display subtype-dependent methylation patterns with infrequent methylation. MP5 loci were subtype-dependent and infrequently methylated “SD-InfreqM.” Only two tumors were methylated at the BRCA1 locus in the UNC samples and no significant differences were observed by ANOVA between molecular subtypes in a UNC tumors and matched normal breast tissues, with percent CpG methylation values averaged for the entire amplicon. Frequency of methylation is displayed in a scatterplot of b the entire UNC dataset (n = 81 tumors), where each CpG unit in the amplicon is plotted. (Note: similar or overlapping percent methylation values for each CpG within an amplicon by MassARRAY will appear as one dot in the UNC scatterplots). A significant difference was observed in β values for the BRCA1-matched cg08993267 Illumina probe between molecular subtypes in the c TCGA-matched tumor normal dataset (sample size n = 70). Frequency of methylation is displayed in a scatterplot of d the entire TCGA dataset (n = 455 tumors). A significant difference in percent methylation was observed in PHGDH between molecular subtypes in e the UNC dataset and recapitulated in g the TCGA dataset (PHGDH probe cg26791905). Methylation frequency is displayed in scatterplot; f the entire UNC tumor dataset and h the entire TCGA tumor dataset. ANOVA p values for testing methylation differences between molecular subtypes is provided in the top right of each boxplot
Fig. 7
Fig. 7
ad Plotting contributors of significant inverse correlations with gene expression. Methylation beta values were plotted against mRNA (logbase2 normalized values) in the TCGA dataset, with each data point representing a tumor (n = 455 tumors). Tumor subtype is displayed by the color of each data point (Basal = red, HER2-enriched = pink, Luminal A = dark blue, and Luminal B = light blue). a MIA methylation correlation with gene expression in tumors is driven by the subset of basal tumors with methylation β values < 0.5, and by the six outlier Lumina A matched normal samples. When both the relatively hypomethylated subset of basal tumors and outlier normal samples were removed, correlations were no longer significant. b GSTP1 also displayed significant overall correlation between methylation and gene expression as well as significant correlations in all subtypes except Basal tumors. c BRCA1 overall correlation between methylation and gene expression was driven mainly by Basal and Luminal B tumors. d PHGDH overall correlation was driven by the significant correlation in Luminal B tumors
Fig. 8
Fig. 8
ae The KRT5 interrogated locus shows high methylation variability. MassARRAY methylation data for the KRT5 gene locus in UNC tumors reveals heterogeneity throughout the 439-bp amplicon. a CpG number 6 in the KRT5 amplicon was significantly (p = 0.04) differentially methylated by ANOVA between tumor subtypes in the UNC samples, but did not have a direct probe match in the TCGA dataset. b CpG unit 20.21 was not differently methylated by ANOVA in the UNC samples, yet was the only CpG unit for which the corresponding c TCGA KRT5 Illumina probe cg04254916 was available. The non-significant ANOVA finding at KRT CpG_20.21 was confirmed in the TCGA (e.g., ANOVA was not significant in either the UNC or TCGA samples at this specific CpG unit). To further illustrate the heterogeneity observed in the KRT5 amplicon, d correlation analysis between individual CpGs and gene expression reveal CpGs as close as 23 bp apart have strikingly different correlation values. While many CpGs in the amplicon were significantly inversely correlated to gene expression, several CpGs were not, including CpG 20.21, which is consistent with e the matching TCGA probe not significantly associated with gene expression. ǂ Values for CpG fragments falling near or outside the mass Dalton detection window cannot be reliably quantified and are, therefore, excluded by the MassARRAY Epityper analytical software. These include KRT5 CpGs 1, 3, 4, 5, 11, 12, 14, 15, 17, 18, 19, and 22. * Significant correlation between methylation and gene expression by individual CG

References

    1. Baylin SB, Esteller M, Rountree MR, Bachman KE, Schuebel K, Herman JG. Aberrant patterns of DNA methylation, chromatin formation and gene expression in cancer. Hum Mol Genet. 2001;10:687–692. doi: 10.1093/hmg/10.7.687. - DOI - PubMed
    1. Belinsky SA. Gene-promoter hypermethylation as a biomarker in lung cancer. Nature reviews. Cancer. 2004;4:707–717. - PubMed
    1. Cancer Genome Atlas N Comprehensive molecular portraits of human breast tumours. Nature. 2012;490:61–70. doi: 10.1038/nature11412. - DOI - PMC - PubMed
    1. Coolen MW, Statham AL, Gardiner-Garden M, Clark SJ. Genomic profiling of CpG methylation and allelic specificity using quantitative high-throughput mass spectrometry: critical evaluation and improvements. Nucleic Acids Res. 2007;35:e119. doi: 10.1093/nar/gkm662. - DOI - PMC - PubMed
    1. Das PM, Singal R. DNA methylation and cancer. J Clin Oncol. 2004;22:4632–4642. doi: 10.1200/JCO.2004.07.151. - DOI - PubMed

Publication types

LinkOut - more resources