

doi: 10.1038/nmeth.2727.
Epub 2013 Nov 10.
Quantifying the local resolution of cryo-EM density maps
Affiliations
- PMID: 24213166
- PMCID: PMC3903095
- DOI: 10.1038/nmeth.2727
Item in Clipboard
Quantifying the local resolution of cryo-EM density maps
Nat Methods.
2014 Jan.
Abstract
We propose a definition of local resolution for three-dimensional electron cryo-microscopy (cryo-EM) density maps that uses local sinusoidal features. Our algorithm has no free parameters and is applicable to other imaging modalities, including tomography. By evaluating the local resolution of single-particle reconstructions and subtomogram averages for four example data sets, we report variable resolution across a 4- to 40-Å range.
Figures
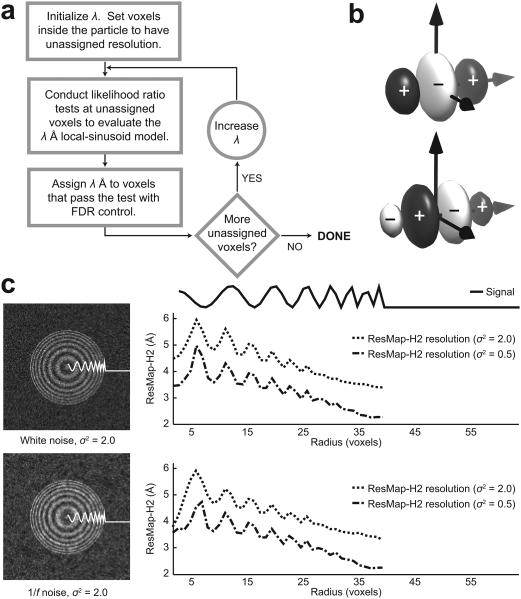
Local resolution. (a) The ResMap algorithm. Wavelength λ is initialized to twice the voxel spacing. Likelihood ratio tests decide whether the local-sinusoid model is detectable at each voxel. Voxels that pass the test are controlled for false discoveries. Voxels that fail the test are tested again after increasing λ (Online Methods). (b) Cosine- and sine-like H2 functions oriented along an axis. White and black indicate negative and positive parts, respectively (Supplementary Note 1). (c) Left, slice through noisy simulated density maps with voxel spacing 1Å. Right, radial plots. ResMap-H2 resolution estimates show a steady improvement as the simulated signal becomes more finely varying. Bottom, corresponding results for 1/f noise display robustness against non-white noise (Supplementary Fig. 1).
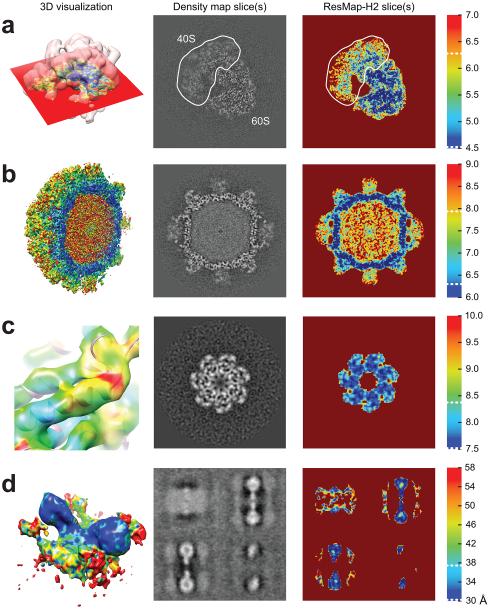
ResMap-H2 results using experimental density maps. Color bars apply to both volumes and slices. 3D visualizations are rendered using UCSF Chimera. White dotted lines in color bars indicate FSC 0.143 and 0.5 thresholds from the original publications. (a) 80S ribosome (EMD-2275). ResMap-H2 results indicate a decreased resolution within the 40S subunit and near the edges of the particle. (b) Tulane virus (EMD-5529). ResMap estimates lower resolutions in the protruding domains while the shell appears well-resolved. (c) Subtomogram GroEL (uncropped version of EMD-2221). ResMap-H2 results show an α-helix with varying levels of resolution (Supplementary Vid. 1). (d) Subtomogram ATP synthase dimer (uncropped version of EMD-2161). ResMap delineates the central dimer as better resolved than the neighboring dimers and membrane.
References
Publication types
MeSH terms
Substances
Grants and funding
LinkOut - more resources
Full Text Sources
Other Literature Sources
