. 2013 Dec 12;504(7479):306-310.
doi: 10.1038/nature12716. Epub 2013 Nov 10.

Chromatin connectivity maps reveal dynamic promoter-enhancer long-range associations

Affiliations

Chromatin connectivity maps reveal dynamic promoter-enhancer long-range associations

Yubo Zhang et al. Nature. .

Abstract

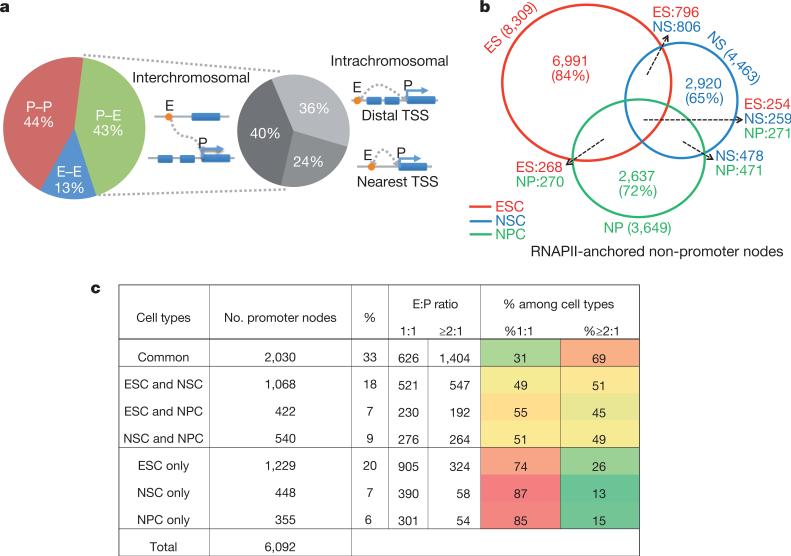
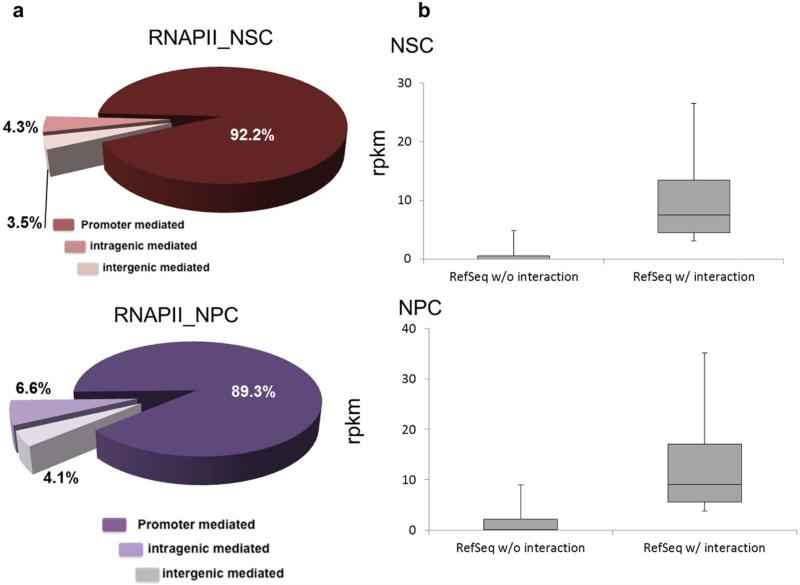
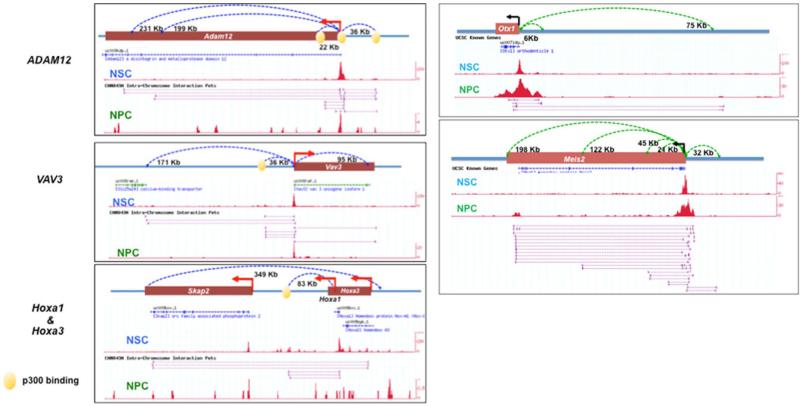
In multicellular organisms, transcription regulation is one of the central mechanisms modelling lineage differentiation and cell-fate determination. Transcription requires dynamic chromatin configurations between promoters and their corresponding distal regulatory elements. It is believed that their communication occurs within large discrete foci of aggregated RNA polymerases termed transcription factories in three-dimensional nuclear space. However, the dynamic nature of chromatin connectivity has not been characterized at the genome-wide level. Here, through a chromatin interaction analysis with paired-end tagging approach using an antibody that primarily recognizes the pre-initiation complexes of RNA polymerase II, we explore the transcriptional interactomes of three mouse cells of progressive lineage commitment, including pluripotent embryonic stem cells, neural stem cells and neurosphere stem/progenitor cells. Our global chromatin connectivity maps reveal approximately 40,000 long-range interactions, suggest precise enhancer-promoter associations and delineate cell-type-specific chromatin structures. Analysis of the complex regulatory repertoire shows that there are extensive colocalizations among promoters and distal-acting enhancers. Most of the enhancers associate with promoters located beyond their nearest active genes, indicating that the linear juxtaposition is not the only guiding principle driving enhancer target selection. Although promoter-enhancer interactions exhibit high cell-type specificity, promoters involved in interactions are found to be generally common and mostly active among different cells. Chromatin connectivity networks reveal that the pivotal genes of reprogramming functions are transcribed within physical proximity to each other in embryonic stem cells, linking chromatin architecture to coordinated gene expression. Our study sets the stage for the full-scale dissection of spatial and temporal genome structures and their roles in orchestrating development.


Figures

Figure 1
Figure 1. RNAPII tethers promoter–enhancer interactions
a, Distribution of promoter-, intragenic- and intergenic-centred interactions in ESCs. The percentages of P–inter, P–intra and P–P interactions are listed. b, Enrichment of H3K4me1 signal density (y axis: RPM, reads per million) along the non-promoter nodes (x axis). Signal from random control regions is shown in blue. c, Enrichment of 12 transcription factors, Ctcf, p300 and MTL (multiple-transcription-factor-binding loci) occupancies at non-promoter regions. d, Boxplot expression (reads per kilobase per million reads (RPKM) as y axis) of the genes with versus without interactions (x axis) in ESCs.
Figure 2
Figure 2. Distal interaction loci display enhancer activities in zebrafish
a, The PET-5 cluster showing an intergenic region, MTL12, on chromosome 15 that targets in trans the npm1 promoter on chromosome 11 in ESCs. Embryos from 8, 12 and 24 hours post fertilization (hpf) are shown with the endogenous npm1a expression pattern as detected by whole-mount in situ hybridization (adapted from ref. with permission). b, A cis-acting interaction region, MTL22, on chromosome 12, 9 kb upstream to the dact1 target gene in ESCs. Zebrafish enhancer assays from 8, 12 and 24 hpf and endogenous dact1 in situ hybridization are shown (adapted from ZFIN (http://zfin.org/) with permission). c, A zebrafish-validated enhancer, mE12, located in the 13th intron of the slc13a4 gene interacts with cell-specific target genes: 1810058I24Rik (cis in NSCs) and sema5b (trans in ESCs). At 24 and 48 hpf, this enhancer drove GFP expression in the somitic muscles and olfactory vesicle. d, Interactions mediated from the ‘poised’ enhancer in ESCs (top), NSCs (middle) and NPCs (bottom). The interactions are schematically depicted (left) and shown in the browser (right). Suz12, Zfx and p300 (ref. 12) binding are illustrated. Zebrafish embryo with representative forebrain expression at 48 hpf is shown at the bottom.
Figure 3
Figure 3. Characterization of putative enhancer–promoter targeting
a, Distributions of P–P, E–E and E–P interactions in ESCs (left) and interchromosomal, intrachromosomal with nearest promoters and intrachromosomal with distal targeting promoters (right). The dotted lines indicate the relative portions of different targeting patterns derived from only the P–E interactions. b, Venn diagram of non-promoter nodes defined among ESCs, NSCs and NPCs. c, Putative enhancer–promoter pairing relations versus their cell specificities.
Figure 4
Figure 4. Connectivity networks converged by key transcription regulator genes
a, Key re-programming gene network in ESCs. The connectivity was built through two hops of all interactions (light grey lines) mediated from 14 genes. Size of the circles represents the features of the nodes. Colours represent their cell specificities. b, Sox2-centric interaction map in ESCs. All of the Sox2-directly-interacting genes are labelled. Thick grey lines highlight the connectivity between Sox2, Klf1, Klf2 and Klf4. c, d, Olig1–Olig2 interaction networks in NSCs (c) and NPCs (d). Thick black lines highlight their common interactions. Genes involved in neuronal developments are in bold.
Extended Data Figure 1
Extended Data Figure 1. Enrichments of RNAPII ChIP by ChIP-qPCR in three cell lines
a–c, Fold enrichments (y axes) of RNAPII ChIP in selected regions (x axes) from three different cell lines (mouse ESCs (a), NSCs (b) and NPCs (c)) are shown. Two replicates of ChIP were tested via ChIP-qPCR and are represented as different colours (red and blue).
Extended Data Figure 2
Extended Data Figure 2. Schematic overview of ChIA-PET analysis
RNAPII binding sites, intra- and interchromosomal interactions identified from each cell type are shown.
Extended Data Figure 3
Extended Data Figure 3. Promoter-mediated interactions and associated gene expression levels in NSCs and NPCs
a, Distribution of defined interaction between promoters, inter- and intragenic regions in NSCs (top) and NPCs (bottom). b, Boxplots of the expression level (RPKM, y axes) between genes tethered by RNAPII and genes without tethered interactions (x axes) in NSCs (top) and NPCs (bottom).
Extended Data Figure 4
Enhancers for Nanog (top left), Phc1 (top right), Lefty1 (bottom right) and Oct4 (bottom left) uncovered through 3C analysis in mESC V6.5 (middle black track) and ChIA-PET analysis in mESC E14 (bottom red track).
Extended Data Figure 5
Phylogenetic conservation represented by PhastCon scores of the putative enhancer regions in comparison with other types of genomic regions.
Extended Data Figure 6
NSC- and NPC-specific interactions detected from promoters of early developmental genes (left) Adam12 (top; chromosome 7:141165832—141495831), Vav3 (middle; chromosome 3:108932769—109282768) and Hoxa (bottom; chromosome 6:51730841—52230840) as well as key telencephalic homeobox transcription factors (right) Otx1 (top, chromosome 11:21878211—21998210) and Meis2 (bottom, chromosome 2:115603679—116003678). Dotted connecting lines depict the defined interactions with the distances labelled. The RNAPII binding peaks are shown in the middle track, followed by PET mapping in NSCs and NPCs, respectively.
Extended Data Figure 7
Extended Data Figure 7. Examples for interacting promoter nodes with their cell specificity and enhancer connectivity found in all three cell types
a, ESC-specific promoter nodes (Fzd7) with E:P (2:1). b, NSC- and NPC-specific promoter nodes (Fabp7) with E:P (1:1 and M:1 M: multiple, ≥2). c, Promoter nodes (Sox2) found in three different cell lines with dynamic E:P interactions.
Extended Data Figure 8
Extended Data Figure 8. Connectivity constructed from the one-hop interactions mediated from reprogramming factor genes in ESCs
Different colours represent different categories of cell specificity; the different sizes of the nodes represent non-promoter, promoter and iPS (induced pluripotent stem cell) factor nodes.
Extended Data Figure 9
Extended Data Figure 9. Sox2-centric interaction map in NSCs
All the interaction nodes directly connecting Sox2 are highlighted and gene names are labelled. The connectivities between Sox2, Myc and Pou3f2 are highlighted by thick grey lines.

References

    1. Neph S, et al. Circuitry and dynamics of human transcription factor regulatory networks. Cell. 2012;150:1274–1286. - PMC - PubMed
    1. Visel A, et al. ChIP-seq accurately predicts tissue-specific activity of enhancers. Nature. 2009;457:854–858. - PMC - PubMed
    1. Li G, et al. Extensive promoter-centered chromatin interactions provide a topological basis for transcription regulation. Cell. 2012;148:84–98. - PMC - PubMed
    1. Handoko L, et al. CTCF-mediated functional chromatin interactome in pluripotent cells. Nature Genet. 2011;43:630–638. - PMC - PubMed
    1. Fullwood MJ, et al. An oestrogen-receptor-a-bound human chromatin interactome. Nature. 2009;462:58–64. - PMC - PubMed

Publication types

Associated data