. 2013 Dec 27;288(52):36841-54.
doi: 10.1074/jbc.M113.525931. Epub 2013 Nov 8.

A phosphoinositide 3-kinase (PI3K)-serum- and glucocorticoid-inducible kinase 1 (SGK1) pathway promotes Kv7.1 channel surface expression by inhibiting Nedd4-2 protein

Affiliations

A phosphoinositide 3-kinase (PI3K)-serum- and glucocorticoid-inducible kinase 1 (SGK1) pathway promotes Kv7.1 channel surface expression by inhibiting Nedd4-2 protein

Martin Nybo Andersen et al. J Biol Chem. .

Abstract

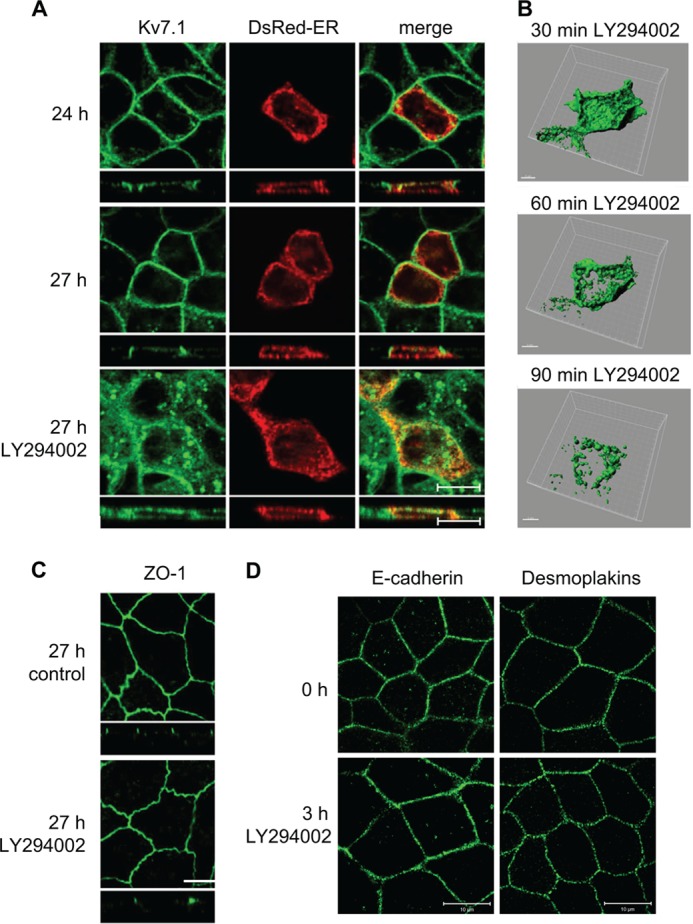
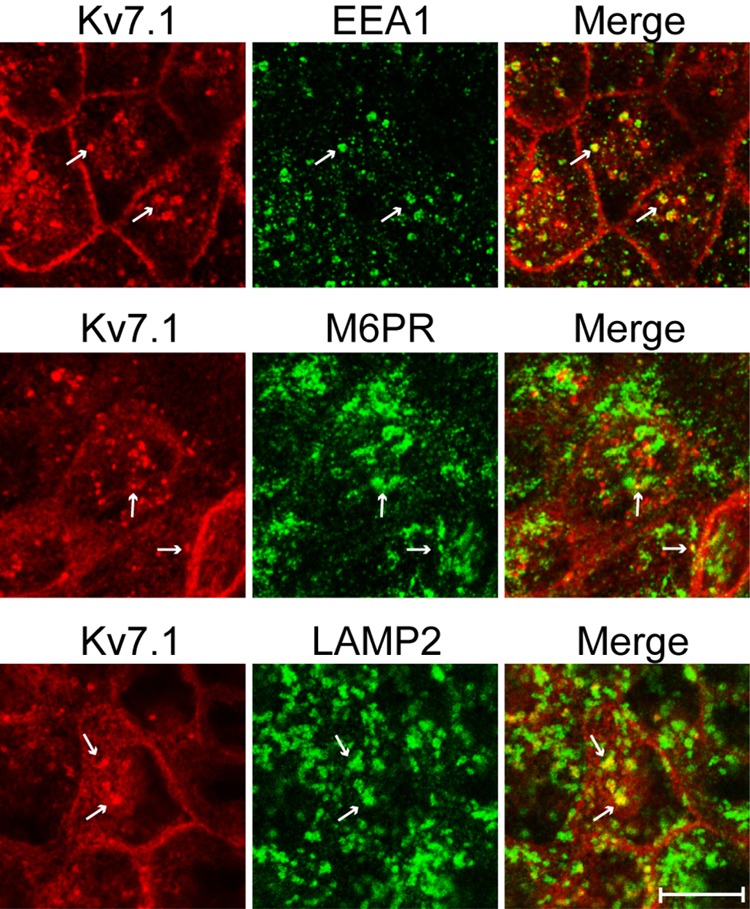
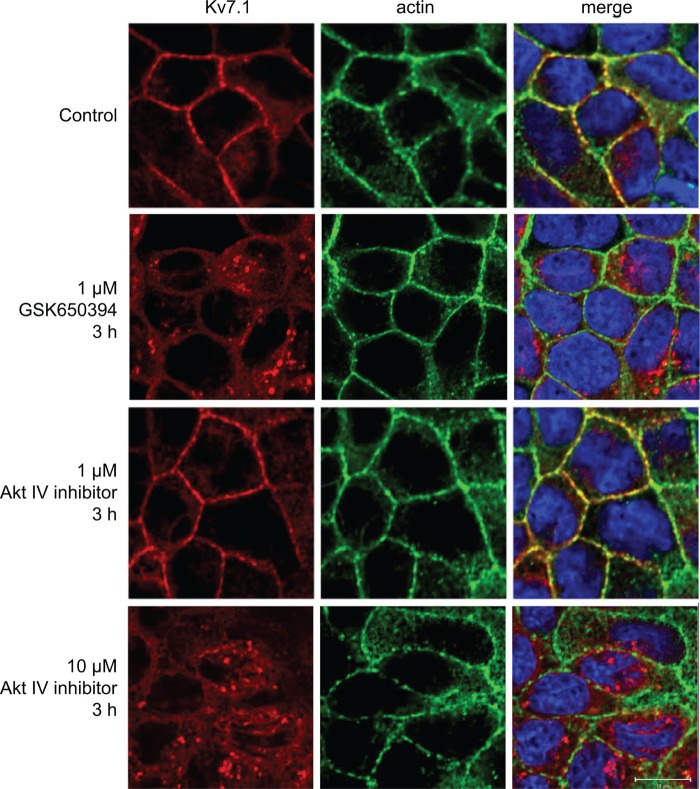
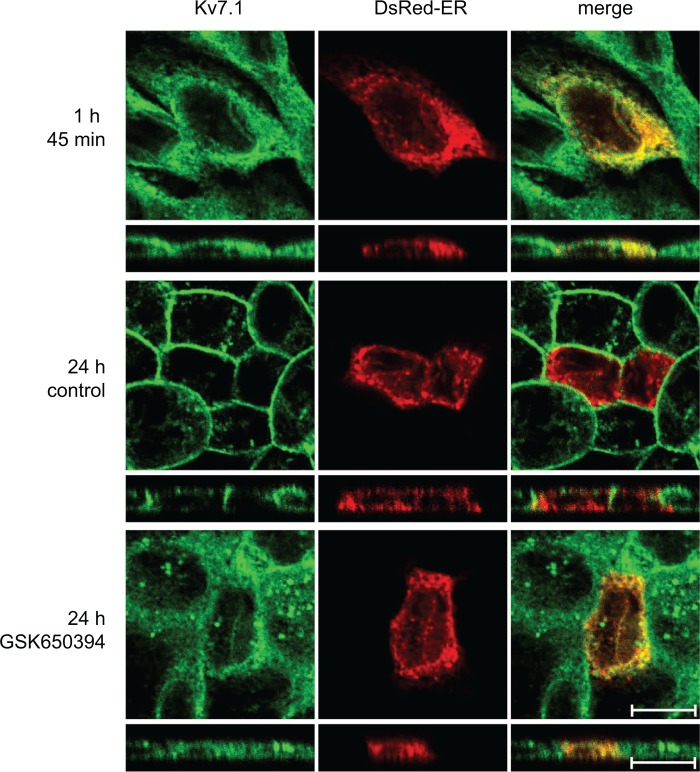
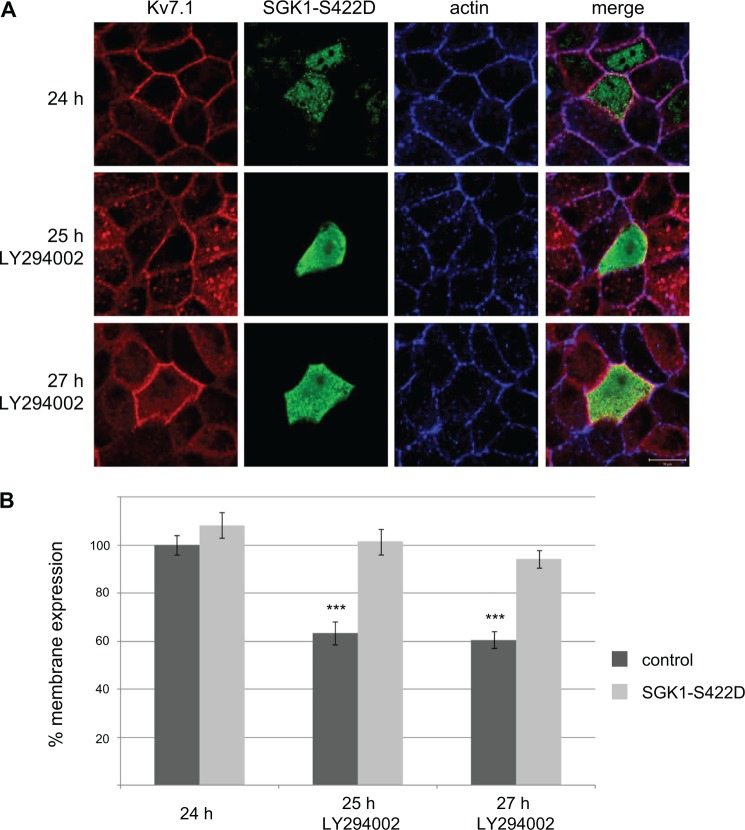
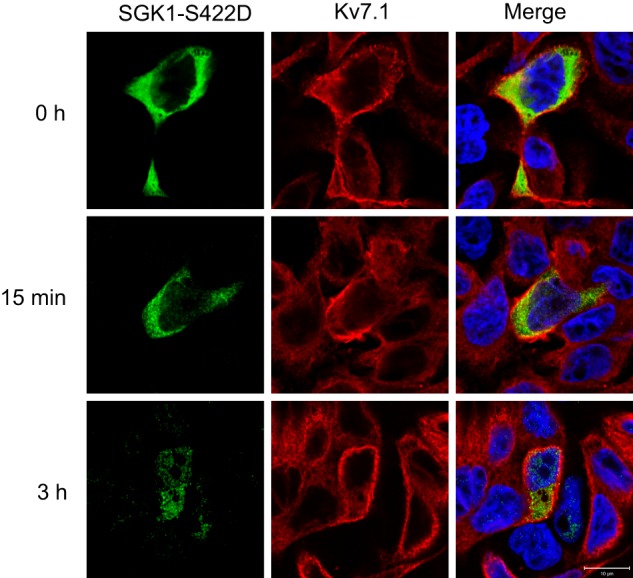
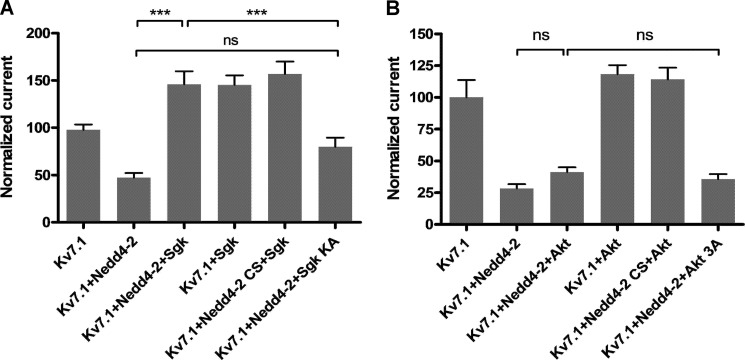
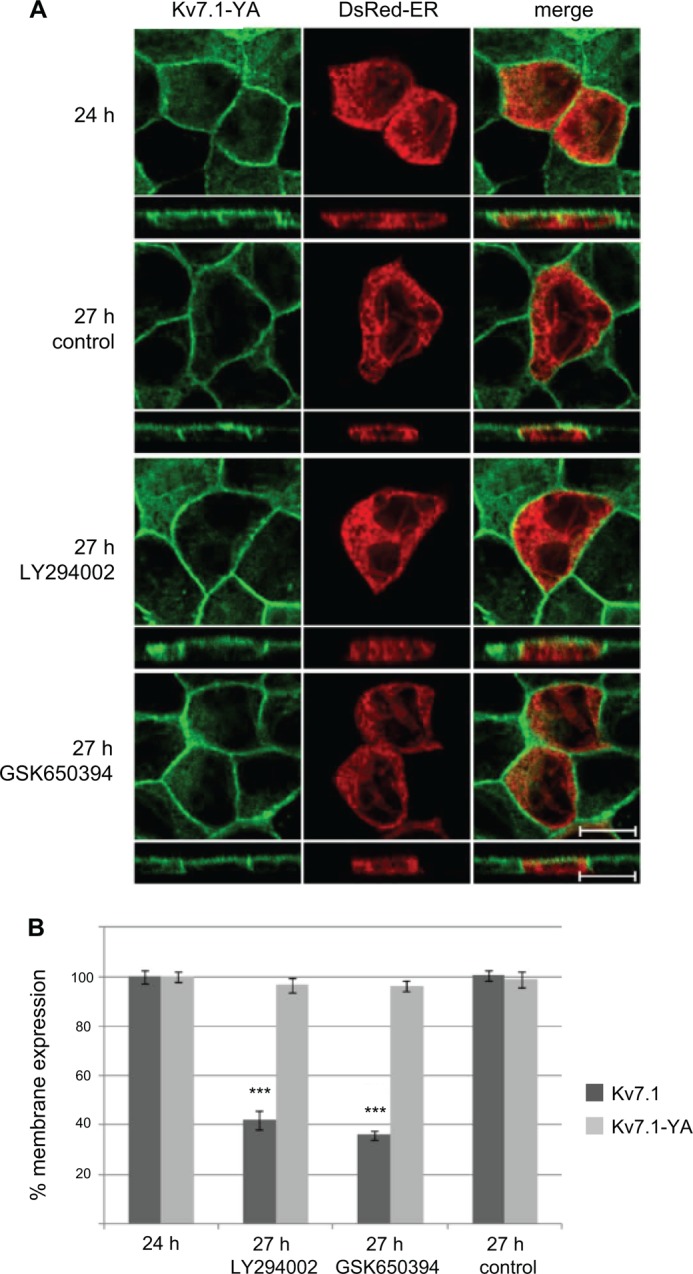
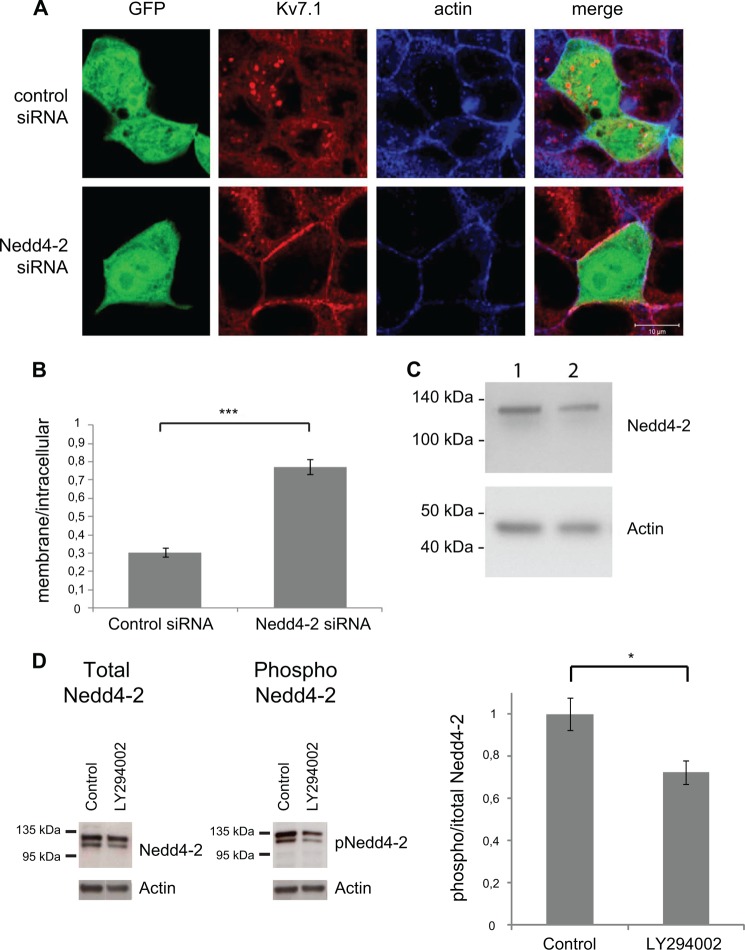
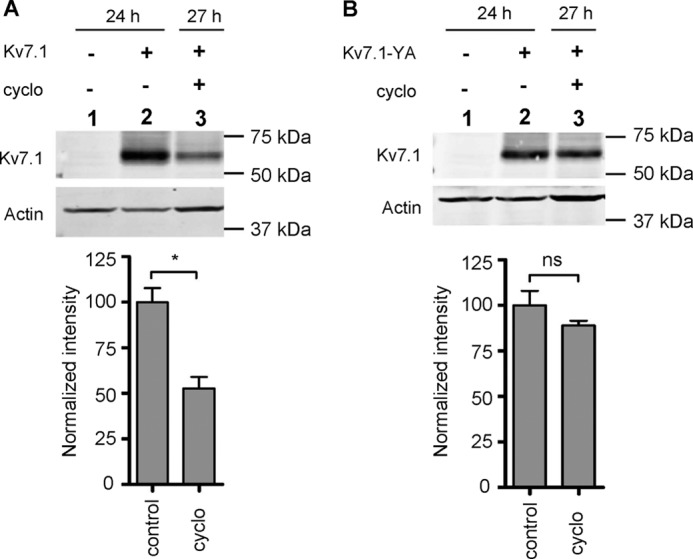
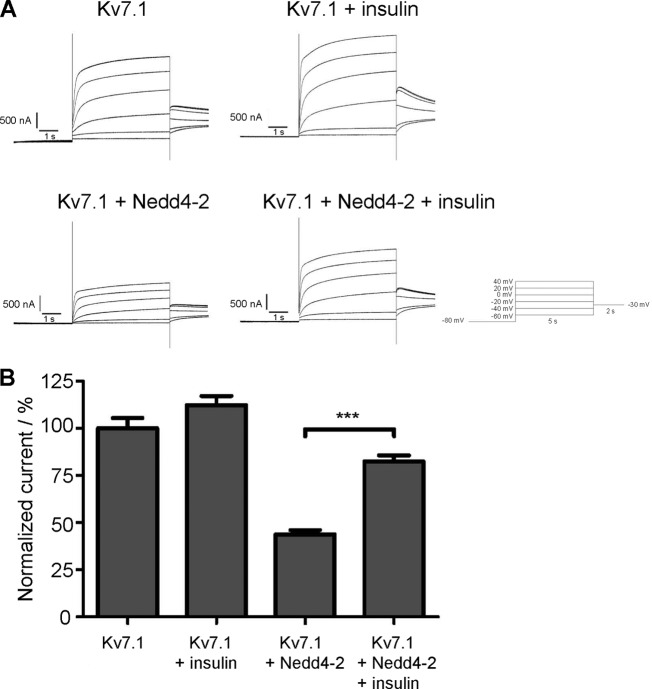
Epithelial cell polarization involves several kinase signaling cascades that eventually divide the surface membrane into an apical and a basolateral part. One kinase, which is activated during the polarization process, is phosphoinositide 3-kinase (PI3K). In MDCK cells, the basolateral potassium channel Kv7.1 requires PI3K activity for surface-expression during the polarization process. Here, we demonstrate that Kv7.1 surface expression requires tonic PI3K activity as PI3K inhibition triggers endocytosis of these channels in polarized MDCK. Pharmacological inhibition of SGK1 gave similar results as PI3K inhibition, whereas overexpression of constitutively active SGK1 overruled it, suggesting that SGK1 is the primary downstream target of PI3K in this process. Furthermore, knockdown of the ubiquitin ligase Nedd4-2 overruled PI3K inhibition, whereas a Nedd4-2 interaction-deficient Kv7.1 mutant was resistant to both PI3K and SGK1 inhibition. Altogether, these data suggest that a PI3K-SGK1 pathway stabilizes Kv7.1 surface expression by inhibiting Nedd4-2-dependent endocytosis and thereby demonstrates that Nedd4-2 is a key regulator of Kv7.1 localization and turnover in epithelial cells.

Keywords: E3 Ubiquitin Ligase; Endocytosis; Ion Channels; KCNQ1; PI 3-Kinase (PI3K); Trafficking.


Figures

FIGURE 1.
FIGURE 1.
Kv7.1 changes localization upon PI3K inhibition in polarized MDCK cells. A, MDCK cells stably expressing Kv7.1 were transiently transfected with pDsRed-ER and subjected to a calcium switch assay for 24 h (24 h). At this point, the medium was changed to NCM containing 10 μm of the PI3K inhibitor LY294002 (27 h LY294002) or just NCM (control, 27 h) for 3 h. The cells were fixed and stained for Kv7.1. Scale bar, 10 μm. B, MDCK cells stably expressing Kv7.1-GFP were subjected to a calcium switch assay for 24 h and thereafter treated with 10 μm LY294002 for up to 1 h and 30 min. Z-stacks were obtained on living cells every 3 min during the experiment and used for three-dimensional reconstruction. Representative cell are illustrated after 30, 60, and 90 min of PI3K inhibitor treatment. Scale bar, 5 μm. C, MDCK-Kv7.1 cells stained for the tight junction protein ZO-1. The cells were subjected to the calcium switch for 24 h and thereafter treated with the LY294002 (10 μm) for 3 h (27 h LY294002). Control cells (27 h control) were not treated with the inhibitor. As illustrated, cell polarization, indicated by the presence of the tight junctions (stained by ZO-1), was unaffected by PI3K inhibition. Scale bar, 10 μm. D, polarized MDCK cells were treated for 3 h with 10 μm LY294002 and then fixed and stained for the adherens junction protein E-cadherin or desmosome components desmoplakins. As shown, 3 h of PI3K inhibition did not affect the localizations of E-cadherin or desmoplakins compared with untreated control cells. Scale bar, 10 μm.
FIGURE 2.
FIGURE 2.
Kv7.1 is endocytosed upon inhibition of PI3K. MDCK cells stably expressing Kv7.1 were subjected to a 24-h calcium switch assay and thereafter treated with 10 μm PI3K inhibitor LY294002 for up to 1 h. The cells were then fixed and co-stained for Kv7.1 and markers of the early endosomes (EEA1), late endosomes (M6PR), and lysosomes (LAMP2). As illustrated, Kv7.1-containing vesicular structures were found to partly co-localize with the three endosomal markers (white arrows). Scale bar, 10 μm.
FIGURE 3.
FIGURE 3.
Inhibition of SGK1 leads to intracellular accumulation of Kv7.1 in polarized MDCK cells. MDCK cells stably expressing Kv7.1 were subjected to a calcium switch for 24 h. The cells were then incubated in NCM containing 1 μm SGK1 inhibitor GSK650394 or 1–10 μm Akt IV inhibitor for 3 h, after which they were fixed and stained for Kv7.1. Illustrated are confocal horizontal and vertical scans of MDCK-Kv7.1 cells before addition of the inhibitor (control), 3 h after addition of the Sgk1 inhibitor (1 μm GSK650394 3 h) or Akt inhibitor (1–10 μm Akt IV inhibitor 3 h), and control cells not treated with the inhibitor (27 h, control). Actin was stained by phalloidin, and DAPI (blue) was used to stain the nucleus (shown in merged pictures). Scale bars, 10 μm.
FIGURE 4.
FIGURE 4.
SGK1 inhibition prevents surface expression of Kv7. 1 in polarizing MDCK cells. MDCK cells stably expressing Kv7.1 were transiently transfected with DsRed-ER cDNA and subjected to a calcium switch in the presence of the SGK1 inhibitor GSK650394 (1 μm). GSK650394 was added 1 h and 45 min after initiation of the switch, and cells were fixed at different time points after initiation of the switch. Illustrated are confocal horizontal and vertical scans of MDCK-Kv7.1 cells before addition of the inhibitor (t = 1 h, 45 min), 24 h after addition of the inhibitor (24 h GSK), and control cells not treated with the inhibitor (24 h control). Scale bar, 10 μm.
FIGURE 5.
FIGURE 5.
Overexpression of constitutively active SGK1 prevents internalization of Kv7. 1 in response to PI3K inhibition. A, MDCK cells stably expressing Kv7.1 were transfected with SGK1-S422D, subjected to a 24-h calcium switch, and then treated with the PI3K inhibitor (LY294002; 10 μm) for 1 and 3 h. The cells were then fixed and stained for Kv7.1, SGK1, and actin. Illustrated are untreated cells (24 h) and polarized cells treated for 1 and 3 h with the inhibitor (25 h LY294002 and 27 h LY294002). Scale bar, 10 μm. B, quantification of the cell surface-associated signal of Kv7.1 in control cells (dark gray bars) and cells expressing the constitutively active SGK1-S422D (light gray bars) in response to PI3K inhibition. The signal obtained 24 h into the calcium switch was set to 100%, and the membrane-associated signals 1 and 3 h after application of PI3K inhibitor (25 h LY294002 and 27 h LY294002) were expressed as a percentage of the signal obtained at 24 h. 9–14 cells were quantified per condition. Quantifications was performed as described under “Experimental Procedures”; ***, p < 0.001. Bars represent means of each group ± S.E.
FIGURE 6.
FIGURE 6.
Overexpression of constitutively active SGK1 prevents internalization of Kv7.1 in response to initiation of a calcium switch. MDCK cells stably expressing Kv7.1 were transiently transfected with SGK1-S422D and subjected to a calcium switch. Cells were fixed before initiation of the switch (t = 0 h), 15 min into the switch (15 min), as well as 3 h after the switch was initiated (3 h). As shown, overexpression of SGK1-S422D prevents the reduction in Kv7.1 cell surface expression observed after 15 min as well as 3 h. Scale bar, 10 μm.
FIGURE 7.
FIGURE 7.
SGK1, but not Akt, counteracts Nedd4-2-mediated down-regulation of Kv7.1 currents in X. laevis oocytes. A, the effect of SGK1 on the Kv7.1 current in X. laevis oocytes. Two-electrode voltage clamp measurements of Xenopus oocytes are shown. The obtained current levels were measured in the end of the +40-mV step. Presented is a summary of three individual two-electrode voltage clamp experiments (n ≥ 6 in each) in oocytes expressing Kv7.1 alone (normalized to 100) or in combination with Nedd4-2/Nedd4-2-CS and/or SGK/SGK KA, where Nedd4-2-CS and SGK KA are catalytically inactive versions of the respective enzymes. The Kv7.1 current measured in oocytes co-expressing Kv7.1, Nedd4-2, and SGK1 was significantly increased compared with oocytes co-expressing Kv7.1, Nedd4-2, and the catalytically inactive version of SGK1 (SGK1 KA). The difference in Kv7.1 current level between oocytes co-expressing Kv7.1 and Nedd4-2 and those additionally expressing SGK1 KA, was not significant. In all of the conditions where active SGK1 was co-expressed, an increased Kv7.1 current, as compared with Kv7.1 alone, was observed; ***, p < 0.001. Bars represent means of each group ± S.E. B, the effect of Akt on the Kv7.1 current in X. laevis oocytes. Two-electrode voltage clamp measurements of Xenopus oocytes are shown. The obtained current levels were measured in the end of the +40-mV step. Presented is a summary of three individual two-electrode voltage clamp experiments (n ≥ 6 in each) in oocytes expressing Kv7.1 alone (normalized to 100) or in combination with Nedd4-2/Nedd4-2-CS and/or Akt/Akt 3A, where Nedd4-2-CS and Akt 3A are catalytically inactive versions of the respective enzymes. Akt has very little or no effect on Nedd4-2-mediated decrease of Kv7.1 current. There was no difference in Kv7.1 current level in oocytes co-expressing Kv7.1, Nedd4-2, and Akt as compared with Kv7.1, Nedd4-2 and catalytically inactive Akt 3A. Bars represent means of each group ± S.E. ns, not significant.
FIGURE 8.
FIGURE 8.
Kv7.1-YA mutant does not change localization upon inhibition of SGK1 and PI3K in polarized cells. A, MDCK cells stably expressing Kv7.1-YA were transiently transfected with DsRed-ER cDNA and subjected to a calcium switch for 24 h. The cells were then incubated in NCM containing SGK1 inhibitor GSK650394 (1 μm) or the PI3K inhibitor LY294002 (10 μm) for 3 h (27 h) and fixed and stained for Kv7.1. Illustrated are untreated cells (27 h control) and polarized cells treated for 3 h with the inhibitors (27 h GSK650394, 27 h LY294002). Scale bar, 10 μm. B, quantification of the cell surface-associated signal of Kv7.1 (dark gray bars) and Kv7.1-YA (light gray bars) in response to PI3K and SGK1 inhibition. The signal obtained 24 h into the calcium switch was set to 100% and the membrane-associated signals 3 h after incubation in NCM without (27 h, control) or with application of PI3K and SGK1 inhibitors (27 h, LY294002 and 27 h, GSK650394) were expressed as a percentage of the 24 h signal. 20–30 cells were quantified per condition. Quantification was performed as described under “Experimental Procedures”; ***, p < 0.001. Bars represent means of each group ± S.E.
FIGURE 9.
FIGURE 9.
Nedd4-2 knockdown protects Kv7.1 from internalization upon PI3K inhibition. A, MDCK cells stably expressing Kv7.1 were transiently co-transfected with eGFP and siRNA targeting Nedd4-2 or a non-coding siRNA, which was used as a negative control. Polarized cells were treated with 10 μm PI3K inhibitor LY294002 for 90 min. The localization of Kv7.1 was examined in transfected cells expressing eGFP (GFP) as these were expected also to be transfected with the siRNA. As demonstrated, Kv7.1 was internalized in cells expressing the non-targeting control siRNA. This internalization was not observed in cells expressing siRNA targeting Nedd-2 (Nedd4-2 siRNA). Scale bar, 10 μm. B, quantification of membrane and intracellular Kv7.1 signals from cells expressing either non-targeting control siRNA or siRNA targeting Nedd4-2 (Nedd4-2 siRNA). The two bars demonstrate the ratios between membrane and intracellular signals in cells expressing the two siRNAs. The data are from four experiments with a total n > 17. The cells transfected with Nedd4-2 siRNA have a significantly higher membrane to intracellular signal ratio than the cells transfected with control siRNA; ***, p < 0.001. Bars represent means of each group ± S.E. C, Western blot of MDCK cells transfected with control siRNA (lane 1) or Nedd4-2 siRNA (lane 2). A reduction in the signal intensity of the band at ∼120 kDa, which correspond to Nedd4-2, is observed in lane 2 compared with the lane 1. Actin was used as a loading control. D, Western blots of cell lysates from polarized, non-treated control MDCK cells (control) and cells treated with 10 μm LY294002 (LY294002) for 2 h. The blots were probed for total Nedd4-2 (left blot) or with Ser-468 phospho-specific Nedd4-2 antibody (right blot). The graph to the right displays band intensity quantifications from n = 3 experiments. The amount of phospho-Nedd4-2 relative to the total amount of Nedd4-2 is shown. The control condition was set to 1. A significant reduction in the relative signal for phospho-Nedd4-2 was observed in response to LY294002 treatment. *, p < 0.05. Actin was used as a loading control.
FIGURE 10.
FIGURE 10.
Kv7.1-YA displays a slower turnover than WT Kv7.1. MDCK cells stably expressing Kv7.1 (A) or Kv7.1-YA (B) were subjected to a 24-h calcium switch and thereafter treated with 40 μg/ml cycloheximide (cyclo) for 3 h to inhibit protein synthesis. Cells were harvested at t = 24 h or t = 27 h, and the resulting protein samples were analyzed by Western blotting. Representative blots illustrating the protein levels of Kv7.1 (A) and Kv7.1-YA (B) are presented. The bottom graphs represent band intensity quantification of n = 3 experiments, where each column corresponds to the lane above. Actin was used as a loading control in each experiment. The protein level was normalized to the control (lane 2 in Fig. 7, A and B, set to 100); *, p < 0.01. Bars represent means of each group ± S.E. ns, not significant.
FIGURE 11.
FIGURE 11.
Insulin rescues Nedd4-2-dependent decrease of Kv7.1 current. A, representative current traces of Kv7.1, Kv7.1 + insulin, Kv7.1 + Nedd4.2, and Nedd4.2 + Kv7.1 + insulin. B, two-electrode voltage clamp experiment on Xenopus oocytes expressing Kv7.1 alone or together with Nedd4-2. The oocytes were incubated in Kulori ± 1 μm insulin for 6 h before measurements. The data are a summary of three individual experiments with a total of 21 < n < 44 oocytes for each group. Insulin treatment significantly increased the current in oocytes co-expressing Kv7.1 and Nedd4-2; ***, p < 0.001. Bars represent means of each group ± S.E.

References

    1. Barhanin J., Lesage F., Guillemare E., Fink M., Lazdunski M., Romey G. (1996) K(V)LQT1 and lsK (minK) proteins associate to form the I(Ks) cardiac potassium current. Nature 384, 78–80 - PubMed
    1. Sanguinetti M. C., Curran M. E., Zou A., Shen J., Spector P. S., Atkinson D. L., Keating M. T. (1996) Coassembly of K(V)LQT1 and minK (IsK) proteins to form cardiac I(Ks) potassium channel. Nature 384, 80–83 - PubMed
    1. Ullrich S., Su J., Ranta F., Wittekindt O. H., Ris F., Rösler M., Gerlach U., Heitzmann D., Warth R., Lang F. (2005) Effects of I(Ks) channel inhibitors in insulin-secreting INS-1 cells. Pflugers. Arch. 451, 428–436 - PubMed
    1. Yamagata K., Senokuchi T., Lu M., Takemoto M., Fazlul Karim M., Go C., Sato Y., Hatta M., Yoshizawa T., Araki E., Miyazaki J., Song W. J. (2011) Voltage-gated K+ channel KCNQ1 regulates insulin secretion in MIN6 β-cell line. Biochem. Biophys. Res. Commun. 407, 620–625 - PubMed
    1. Dedek K., Waldegger S. (2001) Colocalization of KCNQ1/KCNE channel subunits in the mouse gastrointestinal tract. Pflugers. Arch. 442, 896–902 - PubMed

Publication types

MeSH terms

Substances