Genomic and physiological responses to strong selective pressure during late organogenesis: few gene expression changes found despite striking morphological differences
- PMID: 24215130
- PMCID: PMC3835409
- DOI: 10.1186/1471-2164-14-779
Genomic and physiological responses to strong selective pressure during late organogenesis: few gene expression changes found despite striking morphological differences
Abstract
Background: Adaptations to a new environment, such as a polluted one, often involve large modifications of the existing phenotypes. Changes in gene expression and regulation during critical developmental stages may explain these phenotypic changes. Embryos from a population of the teleost fish, Fundulus heteroclitus, inhabiting a clean estuary do not survive when exposed to sediment extract from a site highly contaminated with polycyclic aromatic hydrocarbons (PAHs) while embryos derived from a population inhabiting a PAH polluted estuary are remarkably resistant to the polluted sediment extract. We exposed embryos from these two populations to surrogate model PAHs and analyzed changes in gene expression, morphology, and cardiac physiology in order to better understand sensitivity and adaptive resistance mechanisms mediating PAH exposure during development.
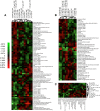
Results: The synergistic effects of two model PAHs, an aryl hydrocarbon receptor (AHR) agonist (β-naphthoflavone) and a cytochrome P4501A (CYP1A) inhibitor (α-naphthoflavone), caused significant developmental delays, impaired cardiac function, severe morphological alterations and failure to hatch, leading to the deaths of reference embryos; resistant embryos were mostly unaffected. Unexpectedly, patterns of gene expression among normal and moderately deformed embryos were similar, and only severely deformed embryos showed a contrasting pattern of gene expression. Given the drastic morphological differences between reference and resistant embryos, a surprisingly low percentage of genes, 2.24% of 6,754 analyzed, show statistically significant differences in transcript levels during late organogenesis between the two embryo populations.
Conclusions: Our study demonstrates important contrasts in responses between reference and resistant natural embryo populations to synergistic effects of surrogate model PAHs that may be important in adaptive mechanisms mediating PAH effects during fish embryo development. These results suggest that statistically significant changes in gene expression of relatively few genes contribute to the phenotypic changes and large morphological differences exhibited by reference and resistant populations upon exposure to PAH pollutants. By correlating cardiac physiology and morphology with changes in gene expression patterns of reference and resistant embryos, we provide additional evidence for acquired resistance among embryos whose parents live at heavily contaminated sites.
Figures


Similar articles
-
PAH-pollution effects on sensitive and resistant embryos: Integrating structure and function with gene expression.PLoS One. 2021 Apr 6;16(4):e0249432. doi: 10.1371/journal.pone.0249432. eCollection 2021. PLoS One. 2021. PMID: 33822796 Free PMC article.
-
The role of the aryl hydrocarbon receptor pathway in mediating synergistic developmental toxicity of polycyclic aromatic hydrocarbons to zebrafish.Toxicol Sci. 2006 Aug;92(2):526-36. doi: 10.1093/toxsci/kfl011. Epub 2006 May 9. Toxicol Sci. 2006. PMID: 16687390
-
Synergistic embryotoxicity of polycyclic aromatic hydrocarbon aryl hydrocarbon receptor agonists with cytochrome P4501A inhibitors in Fundulus heteroclitus.Environ Health Perspect. 2004 Dec;112(17):1658-64. doi: 10.1289/ehp.7168. Environ Health Perspect. 2004. PMID: 15579409 Free PMC article.
-
Recent insights into mammalian natural and synthetic ex utero embryogenesis.Curr Opin Genet Dev. 2022 Dec;77:101988. doi: 10.1016/j.gde.2022.101988. Epub 2022 Sep 28. Curr Opin Genet Dev. 2022. PMID: 36179582 Review.
-
Role of the Synergistic Interactions of Environmental Pollutants in the Development of Cancer.Geohealth. 2022 Apr 1;6(4):e2021GH000552. doi: 10.1029/2021GH000552. eCollection 2022 Apr. Geohealth. 2022. PMID: 35493962 Free PMC article. Review.
Cited by
-
Do stressful conditions make adaptation difficult? Guppies in the oil-polluted environments of southern Trinidad.Evol Appl. 2015 Oct;8(9):854-70. doi: 10.1111/eva.12289. Epub 2015 Sep 4. Evol Appl. 2015. PMID: 26495039 Free PMC article.
-
Functional genomics to assess biological responses to marine pollution at physiological and evolutionary timescales: toward a vision of predictive ecotoxicology.Brief Funct Genomics. 2016 Sep;15(5):358-64. doi: 10.1093/bfgp/elv060. Epub 2015 Dec 22. Brief Funct Genomics. 2016. PMID: 26700295 Free PMC article. Review.
-
Evolutionary toxicology: Meta-analysis of evolutionary events in response to chemical stressors.Ecotoxicology. 2016 Dec;25(10):1858-1866. doi: 10.1007/s10646-016-1735-6. Epub 2016 Oct 3. Ecotoxicology. 2016. PMID: 27699564
-
Regulation of Human Cytochrome P4501A1 (hCYP1A1): A Plausible Target for Chemoprevention?Biomed Res Int. 2016;2016:5341081. doi: 10.1155/2016/5341081. Epub 2016 Dec 26. Biomed Res Int. 2016. PMID: 28105425 Free PMC article. Review.
-
When evolution is the solution to pollution: Key principles, and lessons from rapid repeated adaptation of killifish (Fundulus heteroclitus) populations.Evol Appl. 2017 Apr 26;10(8):762-783. doi: 10.1111/eva.12470. eCollection 2017 Sep. Evol Appl. 2017. PMID: 29151869 Free PMC article. Review.
References
-
- Elskus AA, Monosson E, McElroy AE, Stageman JJ, Woltering DS. Altered CYP1A expression in Fundulus heteroclitus adults and larvae: a sign of pollutant resistance? Aquat Toxicol. 1999;45(2–3):99–113.
-
- Nacci DE, Coiro L, Champlin D, Jayaraman S, Mckinney R, Gleason TR, Munns JWR, Specker JL, Cooper KR. Adaptation of wild populations of the estuarine fish Fundulus heteroclitus to persistant environmental contaminants. Mar Biol. 1999;134:9–17. doi: 10.1007/s002270050520. - DOI
-
- Prince R, Cooper KR. Comparison of the effect of 2,3,7,8-tetrachlorodibenzo-p-dioxin on chemically impacted and nonimpacted subpopulations of Fundulus heteroclitus: II Metabolic Considerations. Environ Toxicol Chem. 1995;14:589–595.
Publication types
MeSH terms
Substances
Grants and funding
LinkOut - more resources
Full Text Sources
Other Literature Sources

