

Self-assembly and bilayer-micelle transition of fatty acids studied by replica-exchange constant pH molecular dynamics
- PMID: 24215478
- PMCID: PMC3946477
- DOI: 10.1021/la403398n
Self-assembly and bilayer-micelle transition of fatty acids studied by replica-exchange constant pH molecular dynamics
Abstract
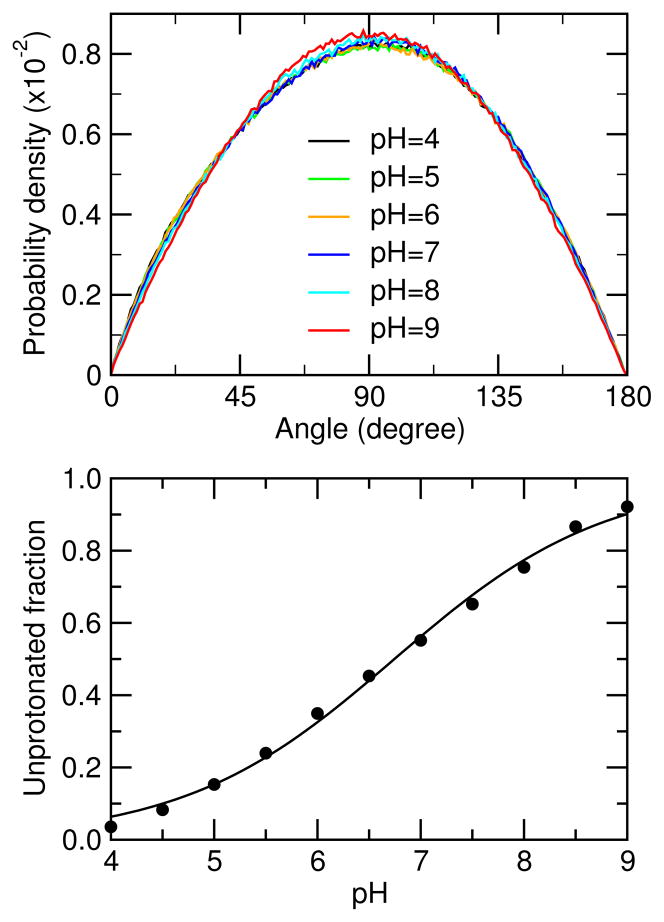
Recent interest in the development of surfactant-based nanodelivery systems targeting tumor sites has sparked our curiosity in understanding the detailed mechanism of the self-assembly and phase transitions of pH-sensitive surfactants. Toward this goal, we applied a state-of-the-art simulation technique, continuous constant pH molecular dynamics (CpHMD) with the hybrid-solvent scheme and pH-based replica-exchange protocol, to study the de novo self-assembly of 30 and 40 lauric acids, a simple model titratable surfactant. We observed the formation of a gel-state bilayer at low and intermediate pH and a spherical micelle at high pH, with the phase transition starting at 20-30% ionization and being completed at 50%. The degree of cooperativity for the transition increases from the 30-mer to the 40-mer. The calculated apparent or bulk pKa value is 7.0 for the 30-mer and 7.5 for the 40-mer. Congruent with experiment, these data demonstrate that CpHMD is capable of accurately modeling large conformational transitions of surfactant systems while allowing the simultaneous proton titration of constituent molecules. We suggest that CpHMD simulations may become a useful tool in aiding in the design and development of pH-sensitive nanocarriers for a variety of biomedical and technological applications.
Figures


Similar articles
-
Predicting proton titration in cationic micelle and bilayer environments.J Chem Phys. 2014 Aug 28;141(8):084714. doi: 10.1063/1.4893439. J Chem Phys. 2014. PMID: 25173037 Free PMC article.
-
Atomistic simulations of pH-dependent self-assembly of micelle and bilayer from fatty acids.J Chem Phys. 2012 Nov 21;137(19):194902. doi: 10.1063/1.4766313. J Chem Phys. 2012. PMID: 23181330 Free PMC article.
-
GPU-Accelerated Implementation of Continuous Constant pH Molecular Dynamics in Amber: pKa Predictions with Single-pH Simulations.J Chem Inf Model. 2019 Nov 25;59(11):4821-4832. doi: 10.1021/acs.jcim.9b00754. Epub 2019 Nov 14. J Chem Inf Model. 2019. PMID: 31661616 Free PMC article.
-
Mixed micelles and other structures in the solubilization of bilayer lipid membranes by surfactants.Biochim Biophys Acta. 2000 Nov 23;1508(1-2):146-63. doi: 10.1016/s0005-2736(00)00309-6. Biochim Biophys Acta. 2000. PMID: 11090823 Review.
-
Molecular dynamics simulations of biological membranes and membrane proteins using enhanced conformational sampling algorithms.Biochim Biophys Acta. 2016 Jul;1858(7 Pt B):1635-51. doi: 10.1016/j.bbamem.2015.12.032. Epub 2016 Jan 5. Biochim Biophys Acta. 2016. PMID: 26766517 Free PMC article. Review.
Cited by
-
Effect of monovalent salt concentration and peptide secondary structure in peptide-micelle binding.RSC Adv. 2021 Nov 17;11(58):36836-36849. doi: 10.1039/d1ra06772a. eCollection 2021 Nov 10. RSC Adv. 2021. PMID: 35494385 Free PMC article.
-
Mechanism of the pH-Controlled Self-Assembly of Nanofibers from Peptide Amphiphiles.J Phys Chem C Nanomater Interfaces. 2014 Jul 24;118(29):16272-16278. doi: 10.1021/jp5048024. Epub 2014 Jul 4. J Phys Chem C Nanomater Interfaces. 2014. PMID: 25089166 Free PMC article.
-
Predicting proton titration in cationic micelle and bilayer environments.J Chem Phys. 2014 Aug 28;141(8):084714. doi: 10.1063/1.4893439. J Chem Phys. 2014. PMID: 25173037 Free PMC article.
-
Recent development and application of constant pH molecular dynamics.Mol Simul. 2014 Jan 1;40(10-11):830-838. doi: 10.1080/08927022.2014.907492. Mol Simul. 2014. PMID: 25309035 Free PMC article.
-
Optimizing Excipient Properties to Prevent Aggregation in Biopharmaceutical Formulations.J Chem Inf Model. 2024 Jan 8;64(1):265-275. doi: 10.1021/acs.jcim.3c01898. Epub 2023 Dec 19. J Chem Inf Model. 2024. PMID: 38113509 Free PMC article.
References
-
- Wagner V, Dullaart A, Bock AK, Zweck A. The emerging nanomedicine landscape. Nat Biotechnol. 2006;24:1211–1217. - PubMed
-
- Torchilin VP. Recent advances with liposomes as pharmaceutical carriers. Nat Rev Drug Discov. 2005;4:145–160. - PubMed
-
- Lardner A. The effects of extracellular pH on immune function. J Leukocyte Biol. 2001;69:522–530. - PubMed
-
- Gatenby RA, Gillies RJ. Why do cancers have high aerobic glycolysis? Nat Rev Cancer. 2004;4:891–899. - PubMed
-
- Yatvin M, Kreutz W, Horwitz B, Shinitzky M. pH-sensitive liposomes: possible clinical implications. Science. 1980;210:1253–1255. - PubMed
Publication types
MeSH terms
Substances
Grants and funding
LinkOut - more resources
Full Text Sources
Other Literature Sources
Miscellaneous
