. 2014 Jan;184(1):214-29.
doi: 10.1016/j.ajpath.2013.10.005. Epub 2013 Nov 9.

HCV infection selectively impairs type I but not type III IFN signaling

Affiliations

HCV infection selectively impairs type I but not type III IFN signaling

Partha K Chandra et al. Am J Pathol. 2014 Jan.

Abstract

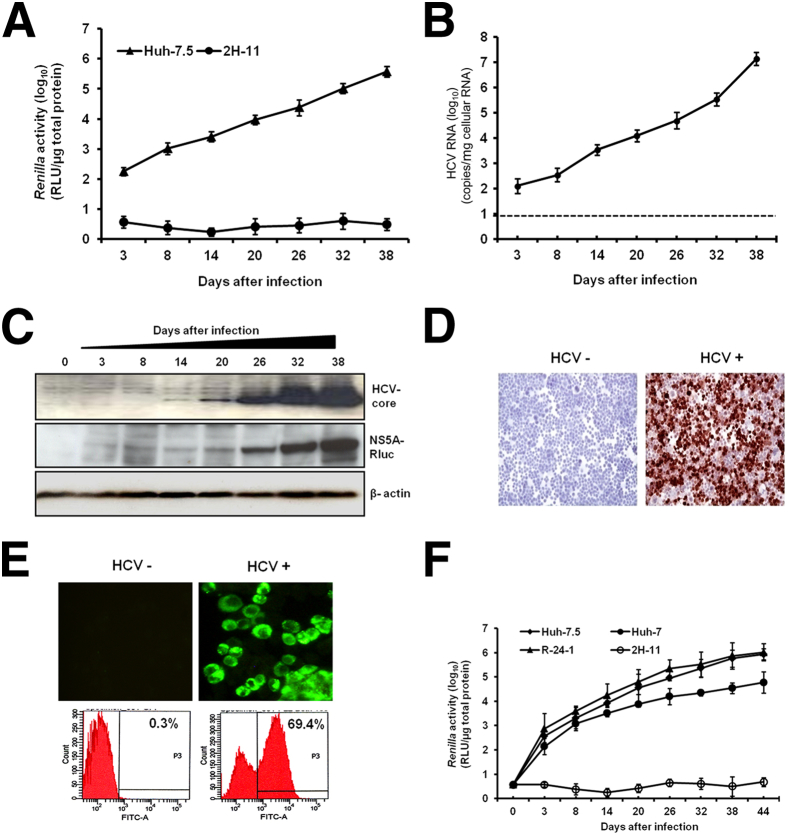
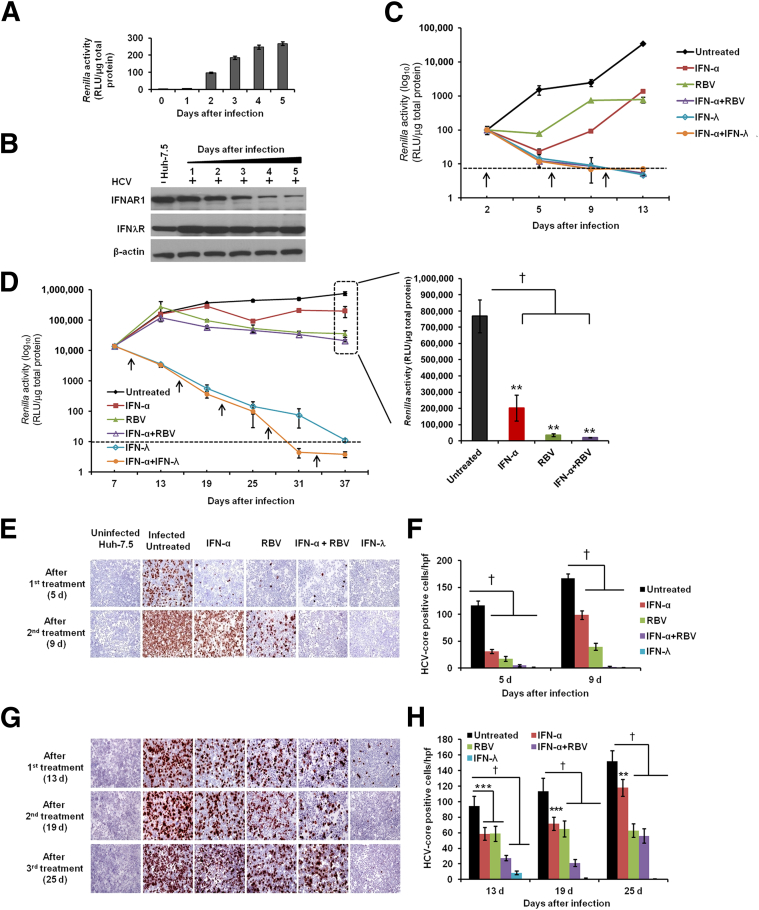
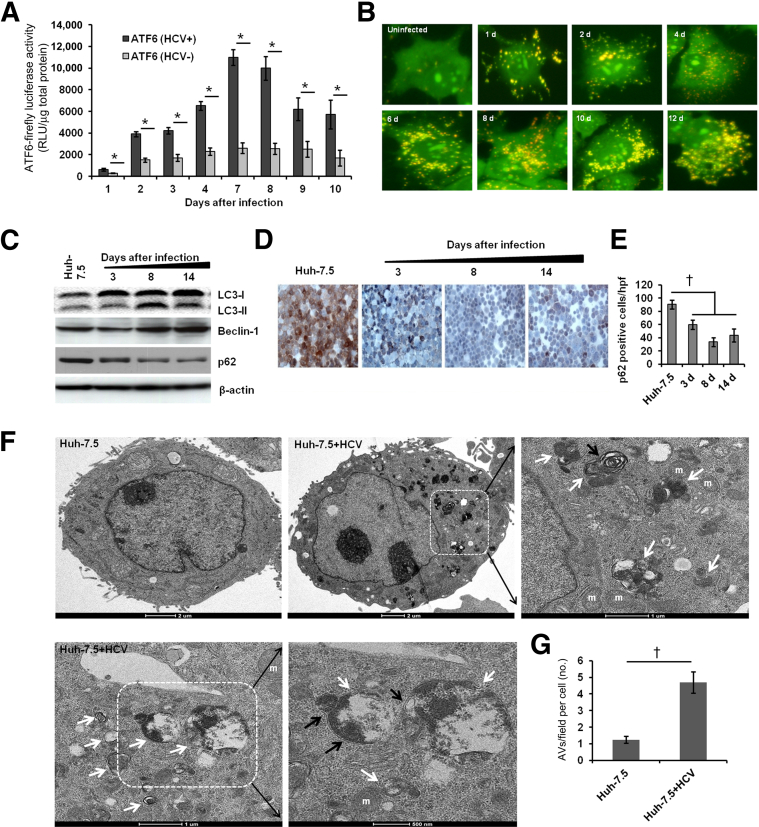
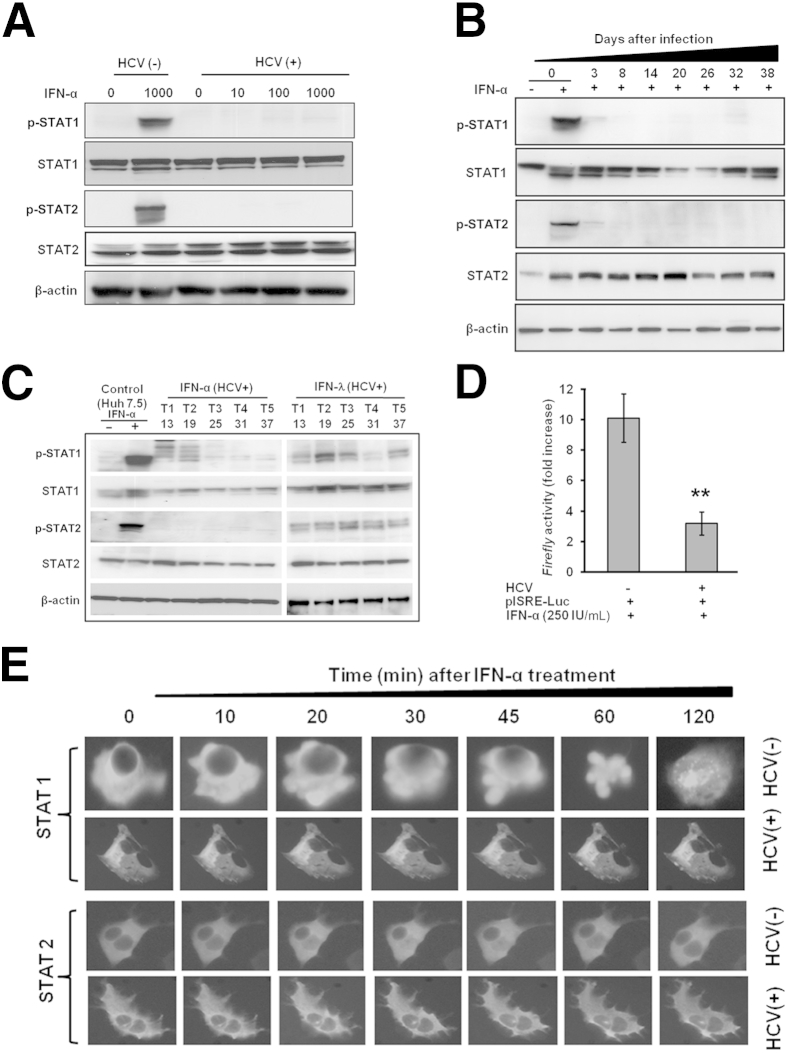
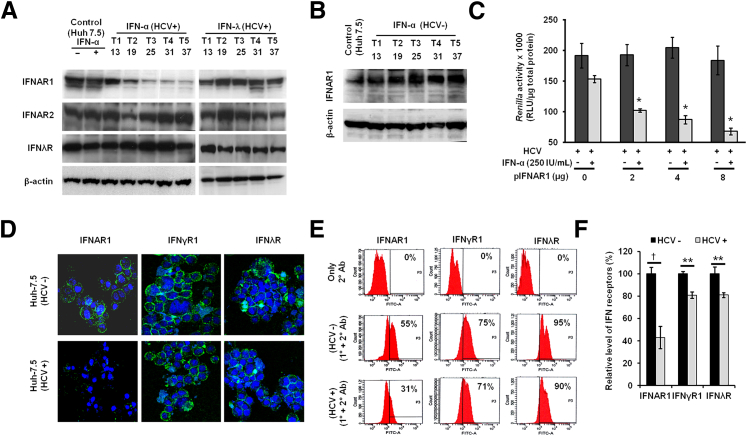
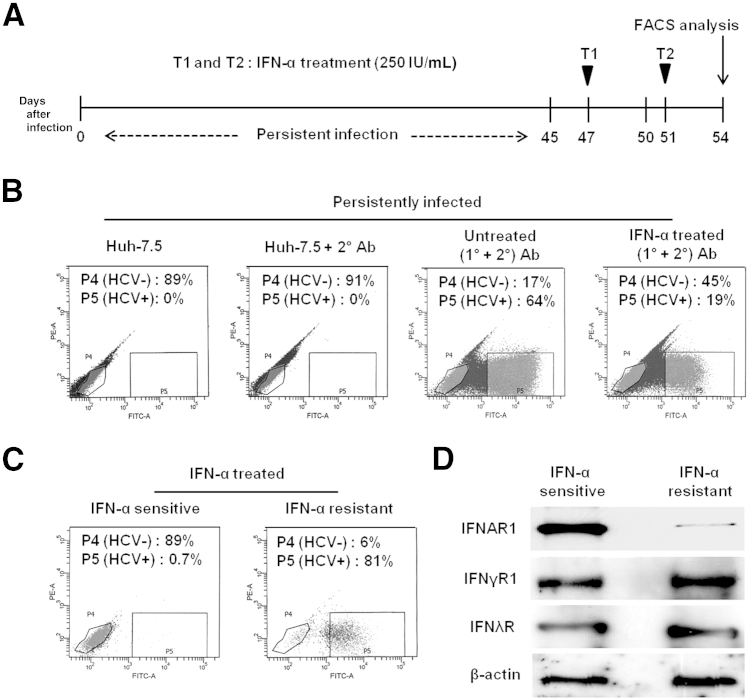
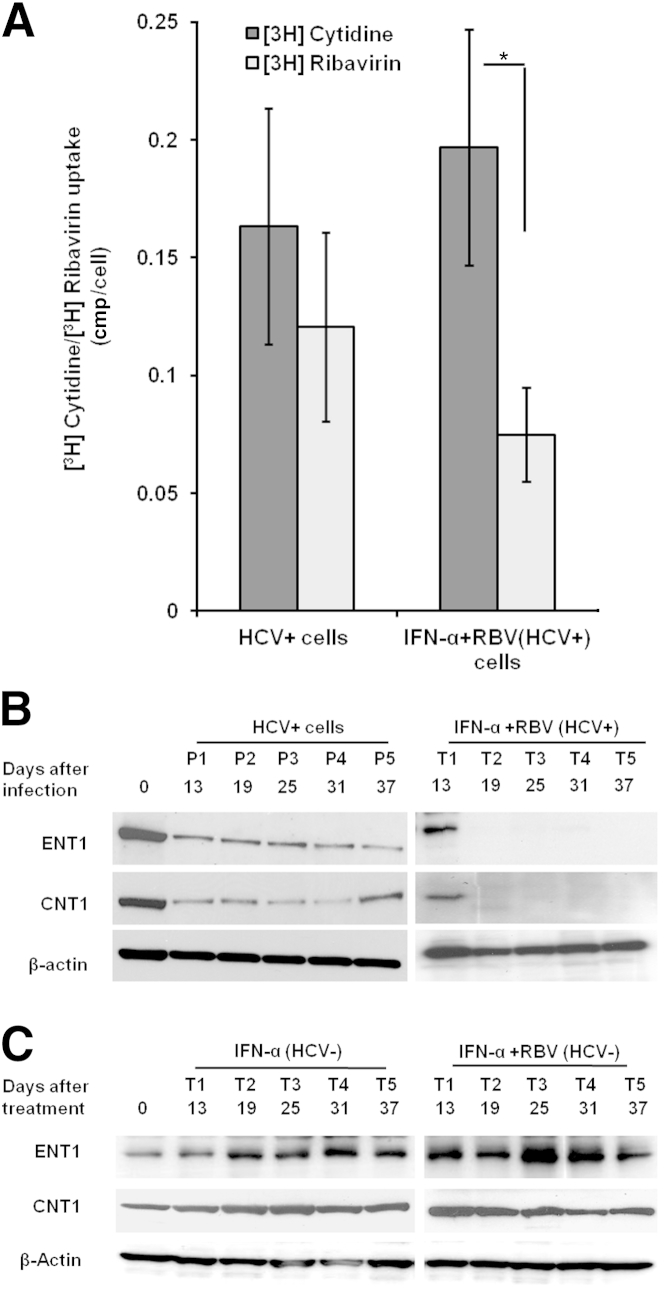
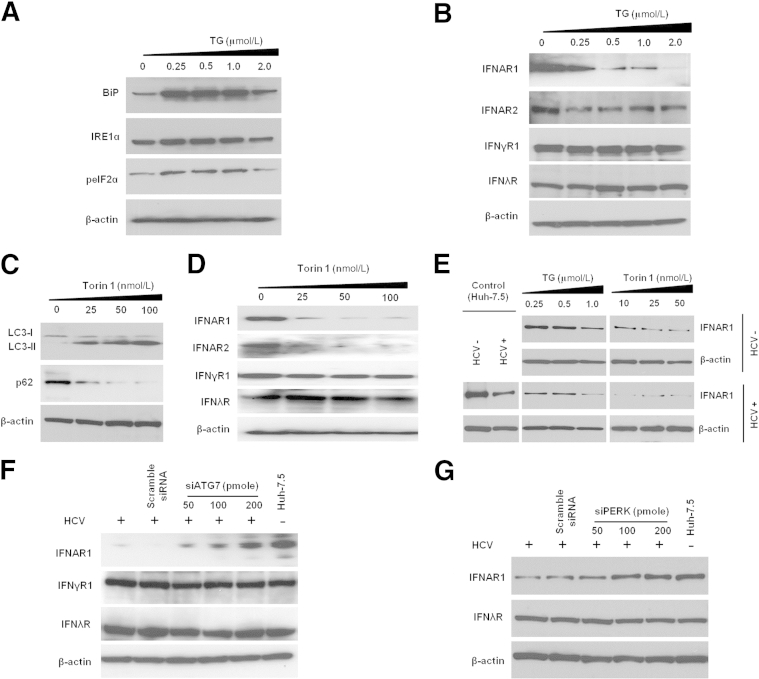
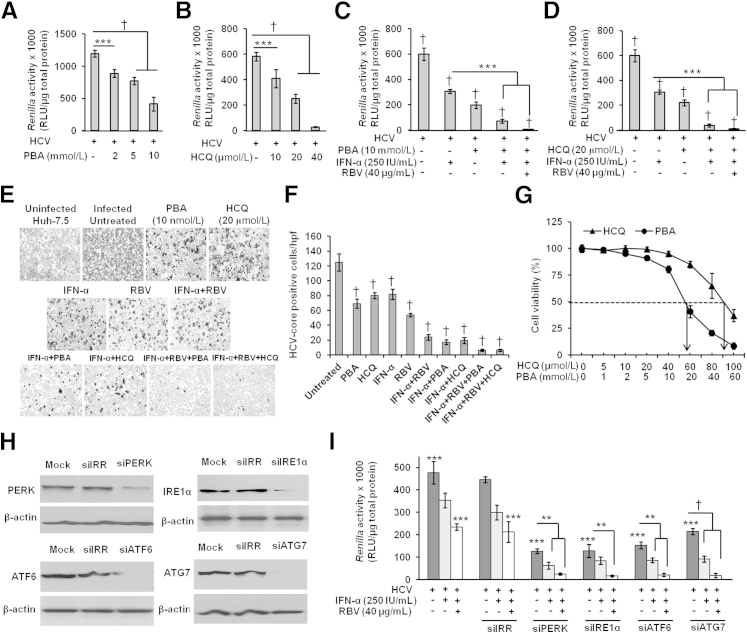
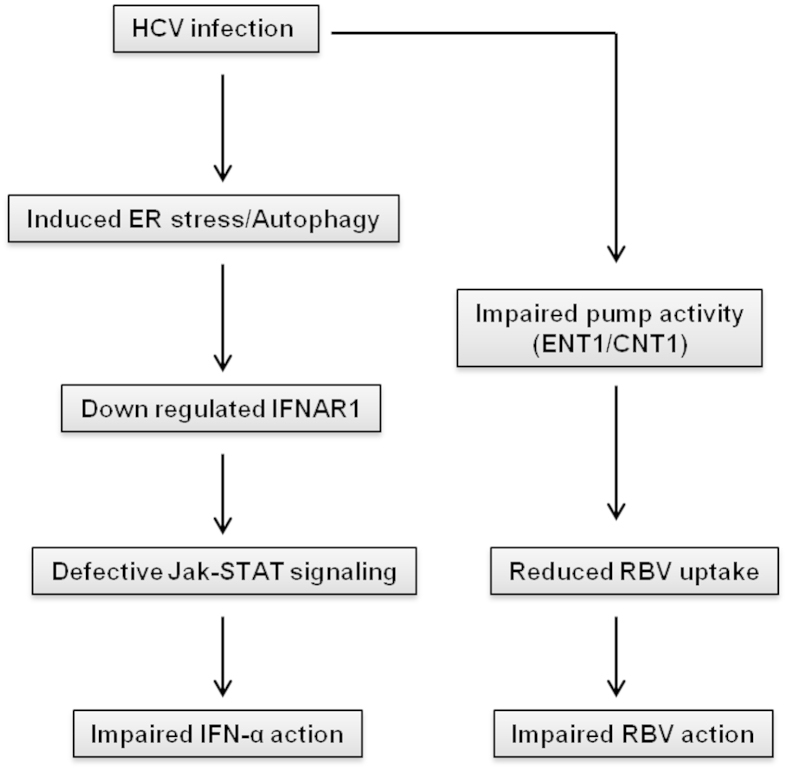
A stable and persistent Hepatitis C virus (HCV) replication cell culture model was developed to examine clearance of viral replication during long-term treatment using interferon-α (IFN-α), IFN-λ, and ribavirin (RBV). Persistently HCV-infected cell culture exhibited an impaired antiviral response to IFN-α+RBV combination treatment, whereas IFN-λ treatment produced a strong and sustained antiviral response that cleared HCV replication. HCV replication in persistently infected cells induced chronic endoplasmic reticulum (ER) stress and an autophagy response that selectively down-regulated the functional IFN-α receptor-1 chain of type I, but not type II (IFN-γ) or type III (IFN-λ) IFN receptors. Down-regulation of IFN-α receptor-1 resulted in defective JAK-STAT signaling, impaired STAT phosphorylation, and impaired nuclear translocation of STAT. Furthermore, HCV replication impaired RBV uptake, because of reduced expression of the nucleoside transporters ENT1 and CNT1. Silencing ER stress and the autophagy response using chemical inhibitors or siRNA additively inhibited HCV replication and induced viral clearance by the IFN-α+RBV combination treatment. These results indicate that HCV induces ER stress and that the autophagy response selectively impairs type I (but not type III) IFN signaling, which explains why IFN-λ (but not IFN-α) produced a sustained antiviral response against HCV. The results also indicate that inhibition of ER stress and of the autophagy response overcomes IFN-α+RBV resistance mechanisms associated with HCV infection.


Figures

Figure 1
Figure 1
Establishment of a stable and persistently infected HCV replication system in Huh-7.5 cells. Cells were infected with MOI = 0.1 JFH-ΔV3-Rluc virus overnight. The infected cells were cultured in DMEM with 10% (v/v) FBS, with passage every 6 days. A: The Renilla luciferase activity of infected cell lysates measured up to 38 days in culture indicates HCV replication after infection. The human fibroblast cell line (2H-11) was used as a negative control. B: HCV RNA level in the infected culture over 38 days. The dotted line indicates the limit of detection of the assay. C: HCV Core and NS5A–Rluc protein levels by time after infection, measured by Western blotting, with β-actin as a loading control. D: Immunocytochemical staining of uninfected (HCV) and infected (HCV+) Huh-7.5 cells, using a monoclonal antibody specific for HCV Core protein; positive staining is reddish-brown. E: HCV Core protein was detected by immunofluorescence; the presence of HCV+ cells was confirmed by flow cytometric analysis and is reported as the percentage of HCV+ cells in the infected culture. F: Infectivity assay of culture supernatants was performed using three different hepatic cell lines (R-24-1 is an IFN-α–resistant Huh-7 cell line) and one nonhepatic cell line (2H-11). Cells were infected with 1 mL of MOI = 0.1 culture supernatant overnight, washed, and then cultured with growth medium. Cells were passaged at 6-day intervals, and Renilla luciferase activity of cell lysates was measured. Data are expressed as means ± SD. Original magnification: ×20 (D); ×40 (E). FITC, fluorescein isothiocyanate; RLU, relative light units.
Figure 2
Figure 2
HCV replication in persistently infected Huh-7.5 cell culture is partially resistant to IFN-α and RBV but not to IFN-λ treatment. A: Infection kinetics of culture supernatant (without passage) in Huh-7.5 cells was determined (MOI = 0.1) by measuring the Renilla luciferase activity, normalized to total protein. B: Levels of IFN-α and IFN-λ receptors (IFNAR1 and IFNλR) in the infected cells were measured by Western blotting, with β-actin as internal control. C: Antiviral response of IFN-α, RBV, and IFN-λ in short-term infected culture. Huh-7.5 cells were infected with cell culture–derived MOI = 0.1 HCV and treated with IFN-α, RBV, or IFN-λ, alone or in combination. The treatment was given every 96 hours (arrows). Antiviral activity was determined by measuring Renilla luciferase activity of cell lysates. D: Antiviral response of 2.5 × IC90 IFN-α, 40 μg/mL RBV, and 10 × IC90 IFN-λ in persistently infected culture. Arrows indicate treatments. To show the partial inhibition of HCV replication by IFN-α and RBV after five consecutive treatments (37 days), viral titer is graphed in greater detail at the left. E and F: HCV Core protein (brown) was detected by immunocytochemistry in 2-day-infected culture (E) and HCV Core+ cells (F) were counted in 10 different high-power fields and compared with untreated controls. G and H: HCV Core protein was detected in persistently infected culture (G) and HCV Core+ cells (H) were counted in 10 different high-power fields and compared with untreated controls. Data are expressed as means ± SD. ∗∗P < 0.01, ∗∗∗P < 0.001, and P < 0.0001. Original magnification, ×40 (E and G). hpf, high-power field (×40).
Figure 3
Figure 3
HCV replication induces ER stress and an autophagy response. A: Uninfected (HCV) and infected (HCV+) Huh-7.5 cells were transfected with ATF6–firefly luciferase reporter plasmid using FuGENE 6 transfection reagent. Luciferase activity in the cell lysates was measured over 10 days. B: Acridine Orange staining shows the induced autophagy response in Huh-7.5 cells infected with HCV. Cells without autophagy show green fluorescence. Cells with autophagy show accumulation of orange-red cytoplasmic autophagic vacuoles. C: Induction of autophagy in the infected cells at different time points was assessed by measuring autophagy-related proteins by Western blotting. D: The level of p62 (brown cytoplasmic staining) in persistently infected cells was measured by immunohistochemistry. E: The p62+ cells in 10 different high-power fields (×40) were counted at 3, 8 and 14 days and compared with uninfected control (Huh-7.5). F: TEM analysis of ultrastructure of uninfected (Huh-7.5) and persistently infected (Huh-7.5+HCV) hepatocytes. Representative high-power micrographs of autophagic vacuoles (AVs) present in the persistently infected cells (white arrow) show atypical double-membrane AVs (black arrow). Boxed regions are shown at higher magnification in the panel to the right. G: During TEM studies, 10 cytoplasmic fields in a grid were captured randomly in each cell. AV numbers per field per cell were compared between uninfected and persistently infected cells. Data are expressed as means ± SD. P < 0.05; P < 0.0001. Original magnification: ×40 (B and D). m, mitochondria.
Figure 4
Figure 4
Persistent HCV replication impairs IFN-α–induced phosphorylation of STAT1 and STAT2 proteins, their nuclear translocation, and ISRE-luciferase promoter activation. A: Uninfected (HCV) and infected cells (HCV+) were treated with 0, 0.1 × IC90, 1 × IC90, and 10 × IC90 IFN-α for 30 minutes. Equal protein amounts were separated on SDS-PAGE gels, and Western blotting analysis was performed using antibodies to p-STAT1, STAT1, p-STAT2, STAT2, and β-actin. B: Phosphorylation of STAT proteins in the persistently infected cells without or with IFN-α over 38 days was measured 30 minutes after treatment by Western blotting. C: HCV-infected cells were treated with 2.5 × IC90 IFN-α or 10 × IC90 IFN-λ. Five consecutive treatments (T1 to T5) were given, and STAT protein levels were measured 30 minutes after each treatment by Western blotting. D: IFN-α induced STAT1 and STAT2 activity in uninfected and infected Huh-7.5 cells. An equal number of uninfected and infected cells were transfected with ISRE-luciferase plasmid. After 3 hours, cells were treated with 2.5 × IC90 IFN-α; on the next day, cells were lysed and luciferase activity was measured. The presence of HCV replication was associated with significantly reduced ISRE-luciferase promoter activity. E: Nuclear translocation of pSTAT1-GFP and pSTAT2-GFP in the uninfected (HCV) and persistently infected (HCV+) cell culture over 120 minutes was monitored by fluorescence microscopy. Data are expressed as means ± SD. ∗∗P < 0.01. Original magnification: ×40 (E).
Figure 5
Figure 5
Persistent HCV replication results in down-regulation of IFNAR1. A: HCV infection selectively down-regulates the IFNAR1 receptor. HCV-infected cells repeatedly treated with 2.5 × IC90 IFN-α or 10 × IC90 IFN-λ. Five consecutive treatments (T1 to T5, day 13 to day 37) were given, and after each treatment the expression of IFNAR1, IFNAR2, and IL10Rβ (IFNλR) was measured by Western blotting, with β-actin as loading control. B: Uninfected Huh-7.5 cells (HCV) were repeatedly treated with IFN-α, and IFNAR1 was measured at the five time points by Western blotting, with β-actin as loading control. C: Overexpression of IFNAR1 by transient transfection increased the IFN-α antiviral response against HCV in the infected cell culture (P < 0.02). Antiviral action of IFN-α was assessed by measuring Renilla luciferase activity 48 hours after treatment and compared with untreated controls. D: The surface expression of IFN-α (IFNAR1), IFN-γ (IFNγR1), and IFN-λ (IL10Rβ) receptors in uninfected and HCV-infected cells was evaluated by confocal microscopy. E: The expression of IFNAR1, IFNγR1, and IL10Rβ in normal (HCV) and persistently infected (HCV+) Huh-7.5 cells was quantified by FACS analysis. Cells incubated with secondary antibody were used as an experimental control. Percentages indicate the proportion of cells expressing IFN receptors. Data are representative of three independent experiments. F: Quantitative expression of IFNAR1, IFNγR1, and IFNλR was determined by FACS analysis. Data are expressed as means ± SD. P < 0.05, ∗∗P < 0.01, and P < 0.0001. Original magnification: ×60 (D). Ab, antibody; 1°, primary; 2°, secondary.
Figure 6
Figure 6
Persistent HCV infection impairs antiviral action of IFN-α via down-regulation of IFNAR1. A: Experimental design. Persistently infected Huh-7.5 cells (45 days of infection) received two consecutive treatments (T1 and T2) with 2.5 × IC90 IFN-α, and then HCV+ and HCV cells were sorted by using FACS. B: Detection of HCV in untreated and IFN-α–treated cells. HCV Core protein was labeled by immunofluorescence technique using green fluorescence secondary antibody and then detected by flow cytometry. Persistently infected cells (Huh-7.5) and cells with only secondary antibody (Huh-7.5 + 2° Ab) were used as controls. C: After IFN-α treatment, HCV (IFN-α–sensitive) and HCV+ (IFN-α–resistant) cell populations were separated by FACS. D: The level of IFN receptors between IFN-α–sensitive and resistant populations was measured by Western blotting, with β-actin as internal control. PE, phycoerythrin.
Figure 7
Figure 7
Impaired RBV uptake and reduced expression of nucleoside transporters in an IFN-α- and RBV-resistant cell strain. A: [3H]Cytidine and [3H]RBV uptake assay. Persistently infected cells were repeatedly treated with IFN-α and RBV for 37 days to produce an IFN-α+RBV–resistant strain of the Huh-7.5 cell line. Persistently infected Huh-7.5 cells were used as a control. Cells were incubated in medium containing [3H]RBV and [3H]cytidine (as a control). [3H]RBV uptake was increased, relative to control (P = 0.02), as determined by scintillation counting. The data were normalized to account for cell numbers. B: Western blot analysis of nucleoside transporters (ENT1 and CNT1) using equal amount of protein lysates from uninfected Huh-7.5 cells, HCV-infected Huh-7.5 cells, and IFN-α+RBV–resistant persistently infected cells at five treatment times (T1 to T5, day 13 to day 37). C: The level of transporters (ENT1 and CNT1) after prolonged IFN-α and IFN-α+RBV treatment in uninfected cells. Huh-7.5 cells received five consecutive treatments (day 13 to day 37) of IFN-α and IFN-α+RBV, and the transporter levels were measured by Western blotting. Data are expressed as means ± SD. P < 0.05.
Figure 8
Figure 8
Induction of ER stress and autophagy response selectively down-regulated the expression of IFN-α receptor 1 measured by Western blotting. A: Huh-7.5 cells were treated with TG, a known ER stress inducer, and the unfolded protein response–related proteins BiP, IRE1α, and peIF2α were measured. B: The level of IFN receptors with increasing concentration of TG was measured. C: Huh-7.5 cells were treated with increasing concentration of Torin 1, a known autophagy inducer, and the autophagy response was assessed by measuring LC3II and p62 levels. D: The level of IFN receptors with increasing concentration of Torin 1 was measured. E: TG and Torin 1 titrations in HCV-infected cells and uninfected cells. IFNAR1 down-regulation was greater in HCV-infected cells treated with autophagy inducer (Torin 1) or ER stress inducer (TG). F: Knockdown by siRNA of ATG7, one of the autophagy genes, rescued IFNAR1 level. Increasing concentration of siATG7 was transfected in the persistently infected Huh-7.5 cells. After 72 hours, cells were lysed and the level of IFN receptors was measured. G: Silencing PERK restores the expression of IFNAR1. siPERK in increasing concentrations was transfected to the persistently infected Huh-7.5 cell. After 72 hours, cells were lysed and the expression of IFNAR1 and IFNλR was measured.
Figure 9
Figure 9
Inhibition of ER stress and autophagy response by chemical inhibitors significantly improves the IFN-α and RBV antiviral effect against HCV in persistently infected cells. A and B: Pretreatment with ER stress inhibitor (PBA) or autophagy inhibitor (HCQ) significantly inhibits HCV replication. Equal numbers of persistently infected cells were treated with different concentrations of PBA (0 to 10 mmol/L) and HCQ (0 to 40 μmol/L) overnight. The next day, cells were incubated with fresh medium; after 72 hours, HCV replication was assessed by measuring Renilla luciferase activity. CE: Pretreatment with PBA and HCQ significantly improved antiviral activity of IFN-α, alone or in combination with RBV, inhibiting HCV replication. Equal numbers of persistently infected cells were treated overnight with 10 mmol/L PBA or 20 μmol/L HCQ. The next day, cells were incubated with fresh medium and treated with 250 IU/mL IFN-α alone or in combination with 40 μg/mL RBV. After 72 hours, HCV replication was assessed by measurement of Renilla luciferase activity (C and D) and HCV Core protein expression by immunostaining (E). F: HCV Core+ cells in 10 different high-power fields (×40) were counted and compared with untreated control. G: Cell viability with PBA or HCQ treatment was assessed by MTT assay. Huh-7.5 cells were treated overnight with different concentrations of PBA (0 to 60 mmol/L) or HCQ (0 to 100 μmol/L). After 72 hours, MTT assay was performed. The IC50 (dashed line) of PBA and of HCQ is indicated by an arrow. H and I: Silencing of ER stress sensors (PERK, IRE1α, ATF6) and the autophagy gene (ATG7) significantly inhibited HCV replication and also improved the antiviral action of IFN-α and RBV. Equal numbers of persistently infected cells were split in a six-well plate. The next day, cells were transfected with the respective siRNAs, mock transfection, or siIRR. After 3 hours of transfection, cells were treated with IFN-α alone or in combination with RBV. After a further 72 hours, a portion of the cells was lysed, and silencing efficacies of the siRNAs were determined by Western blotting (H) and HCV replication was assessed by measuring Renilla luciferase activity (I). All experiments were performed in triplicate. Data are expressed as means ± SD. ∗∗P < 0.01, ∗∗∗P < 0.001, and P < 0.0001.
Figure 10
Figure 10
Schematic of impairment of IFN-α and RBV signaling in persistently HCV-infected culture.

References

    1. Alter M.J. Epidemiology of hepatitis C virus infection. World J Gastroenterol. 2007;13:2436–2441. - PMC - PubMed
    1. Shepard C.W., Finelli L., Alter M.J. Global epidemiology of hepatitis C virus infection. Lancet Infect Dis. 2005;5:558–567. - PubMed
    1. Butt A.A., Kanwal F. Boceprevir and telaprevir in the management of hepatitis C virus-infected patients. Clin Infect Dis. 2012;54:96–104. - PubMed
    1. Dore G.J., Matthews G.V., Rockstroh J. Future of hepatitis C therapy: development of direct-acting antivirals. Curr Opin HIV AIDS. 2011;6:508–513. - PubMed
    1. Halfon P., Locarnini S.J. Hepatitis C virus resistance to protease inhibitors. Hepatology. 2011;55:192–206. - PubMed

Publication types

MeSH terms