. 2013 Dec;10(6):066012.
doi: 10.1088/1741-2560/10/6/066012. Epub 2013 Nov 12.

DataHigh: graphical user interface for visualizing and interacting with high-dimensional neural activity

Affiliations

DataHigh: graphical user interface for visualizing and interacting with high-dimensional neural activity

Benjamin R Cowley et al. J Neural Eng. 2013 Dec.

Abstract

Objective: Analyzing and interpreting the activity of a heterogeneous population of neurons can be challenging, especially as the number of neurons, experimental trials, and experimental conditions increases. One approach is to extract a set of latent variables that succinctly captures the prominent co-fluctuation patterns across the neural population. A key problem is that the number of latent variables needed to adequately describe the population activity is often greater than 3, thereby preventing direct visualization of the latent space. By visualizing a small number of 2-d projections of the latent space or each latent variable individually, it is easy to miss salient features of the population activity.

Approach: To address this limitation, we developed a Matlab graphical user interface (called DataHigh) that allows the user to quickly and smoothly navigate through a continuum of different 2-d projections of the latent space. We also implemented a suite of additional visualization tools (including playing out population activity timecourses as a movie and displaying summary statistics, such as covariance ellipses and average timecourses) and an optional tool for performing dimensionality reduction.

Main results: To demonstrate the utility and versatility of DataHigh, we used it to analyze single-trial spike count and single-trial timecourse population activity recorded using a multi-electrode array, as well as trial-averaged population activity recorded using single electrodes.

Significance: DataHigh was developed to fulfil a need for visualization in exploratory neural data analysis, which can provide intuition that is critical for building scientific hypotheses and models of population activity.


Figures
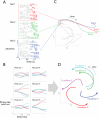
Figure 1
Figure 1
Conceptual illustration of applying dimensionality reduction to neural population activity. A) Comparing population activity across repeated trials of the same experimental condition. Each raster plot corresponds to an individual experimental trial. B) Comparing trial-averaged population activity across different experimental conditions. The peri-stimulus time histograms (PSTHs) of six neurons with five different experimental conditions are shown. C) A dimensionality reduction method (GPFA) was applied to single-trial population activity (three trials are shown in panel A) to extract 15-d single-trial neural trajectories. Each trajectory corresponds to a different experimental trial. S1 and S2 define a 2-d projection of the extracted 15-d latent space. D) A dimensionality reduction method (PCA) was applied to trial-averaged population activity (five experimental conditions are shown in panel B) to extract 6-d trial-averaged neural trajectories. Each trajectory corresponds to a different experimental condition. S1 and S2 define a 2-d projection of the extracted 6-d latent space.
Figure 2
Figure 2
Flow diagram for visualization of population activity. Dimensionality reduction is performed on high-dimensional population activity (n-d, where n is the number of neurons) to extract a latent space (k-d, where k is the number of latent variables). Typically, k is less than n but greater than 3. We can then use DataHigh to visualize many 2-d projections of the same latent space. Shown here are six different 2-d projections of the same 6-d (k = 6) latent space described in section 3.3.
Figure 3
Figure 3
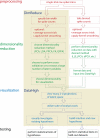
Flowchart for a data analysis procedure that utilizes visualization. The user may input raw spike trains into DataHigh, perform dimensionality reduction using the DimReduce tool (left-hand side of dimensionality reduction), and visualize many 2-d projections of the extracted latent space using DataHigh. The user may also perform dimensionality reduction outside the DataHigh environment (right-hand side of dimensionality reduction), and input the identified latent variables into DataHigh for visualization.
Figure 4
Figure 4
Main interface for DataHigh. Central panel: 2-d projection of 15-d single-trial neural trajectories extracted using GPFA from population activity recorded in premotor cortex during a standard delayed-reaching task for two different reach targets (green and blue) (section 3.2). Dots indicate time of target onset (red) and the go cue (cyan). Gray indicates baseline activity before stimulus onset. Preview panels (left and right of central panel): clicking and holding on a preview panel instantly rotates one of the two projection vectors that make up the central 2-d projection. The bottom right corner shows the percent variance of the latent space that is captured by the central 2-d projection. The Toolbar (far right) allows the user to access analysis tools described in section 2.3.
Figure 5
Figure 5
Find Projection tool. Static 2-d projections found by A: PCA and B: LDA, when applied to the data shown in figure 4. The colors (green and blue) denote different reach targets, and for each reach target, five neural trajectories are shown.
Figure 6
Figure 6
Genetic Search tool. The user selects projections of interest (highlighted in red), and the tool transforms the current projections to be more similar to the selected ones for the next generation. Each panel displays a 2-d projection of single-trial neural trajectories for two reach targets (green and blue). These are all projections of the same 15-d latent space shown in figure 4.
Figure 7
Figure 7
A 3-d projection of trial-averaged neural trajectories from section 3.3 during reaching movements. Each neural trajectory corresponds to one reach condition.
Figure 8
Figure 8
Single Dimension tool. Each panel shows one of the 15 latent variables versus time for the neural trajectories shown in Figure 4. In this case, the latent variables are ordered such that the first latent variable (panel “1”) captures the greatest covariability while the the last latent variable (panel “15”) captures the least covariability in the population activity.
Figure 9
Figure 9
Depth Perception tool. The size of each point corresponds to how close that point is to the user in the projection plane's orthogonal space. The green and blue neural states correspond to two different reach targets, as described in section 3.1. The red neural states are error trials that were incorrectly classified by a Poisson Naïve Bayes classifier.
Figure 10
Figure 10
A: The Capture tool saves selected projections in a queue. A saved projection can be loaded by clicking on its thumbnail. B: Drag Trajectory allows the user to manipulate a neural trajectory by dragging one of the points placed along the trajectory. Each panel plots one of the latent variables versus time (left panels). The result is immediately updated in the 2-d projection display (right panel).
Figure 11
Figure 11
Trial-to-trial variability of neural states during reach planning. Each point corresponds to one trial and is colored according to reach target. For each cluster, the user can choose to display the one-standard-deviation ellipse, cluster mean, and/or the direction of greatest trial-to-trial variability (thick lines). The data corresponds to the example in section 3.1.
Figure 12
Figure 12
DimReduce allows the user to input raw spike trains, perform dimensionality reduction, choose the latent dimensionality, and upload the extracted latent variables to DataHigh. The large red “1” instructs the user where to complete the first step, which is to choose a bin width. Clicking the “Next Step” button increments the red step number and moves it to the next step. The example here shows a plot of leave-neuron-out prediction error versus candidate latent dimensionality. Using this metric, the optimal latent dimensionality is the dimensionality with the minimum cross-validated prediction error (starred on the plot).
Figure 13
Figure 13
An outlying trial (red trace) can be easily identified by rotating the 2-d projection plane. Green trajectories represent single-trial population activity for a single reach target. A subset of these trials is shown in figure 4.
Figure 14
Figure 14
Screenshot of the GGobi graphical user interface while visualizing the same 15-d neural trajectories as shown in figure 4. The left panel allows the user to select which variables to display and which coefficients of the projection vectors to manipulate. The right panel displays a 2-d projection of the 15-d neural trajectories. Clicking and dragging in the right panel modifies the coefficients of the projection vectors selected in the left panel. (GGobi version 2.1.9)

References

    1. Afshar A, Santhanam G, Yu BM, Ryu SI, Sahani M, Shenoy KV. Single-trial neural correlates of arm movement preparation. Neuron. 2011;71(3):555–564. - PMC - PubMed
    1. Asimov D. The grand tour: a tool for viewing multidimensional data. SIAM Journal on Scientific and Statistical Computing. 1985;6(1):128–143.
    1. Averbeck BB, Latham PE, Pouget A. Neural correlations, population coding and computation. Nature Reviews Neuroscience. 2006;7(5):358–366. - PubMed
    1. Bartho P, Curto C, Luczak A, Marguet SL, Harris KD. Population coding of tone stimuli in auditory cortex: dynamic rate vector analysis. Eur J Neurosci. 2009;30(9):1767–78. - PMC - PubMed
    1. Berk R, Brown L, Zhao L. Statistical inference after model selection. Journal of Quantitative Criminology. 2010;26(2):217–236.

Publication types

LinkOut - more resources