. 2013 Nov;123(11):4595-611.
doi: 10.1172/JCI67580.

Induction of myelodysplasia by myeloid-derived suppressor cells

Induction of myelodysplasia by myeloid-derived suppressor cells

Xianghong Chen et al. J Clin Invest. 2013 Nov.

Abstract

Myelodysplastic syndromes (MDS) are age-dependent stem cell malignancies that share biological features of activated adaptive immune response and ineffective hematopoiesis. Here we report that myeloid-derived suppressor cells (MDSC), which are classically linked to immunosuppression, inflammation, and cancer, were markedly expanded in the bone marrow of MDS patients and played a pathogenetic role in the development of ineffective hematopoiesis. These clonally distinct MDSC overproduce hematopoietic suppressive cytokines and function as potent apoptotic effectors targeting autologous hematopoietic progenitors. Using multiple transfected cell models, we found that MDSC expansion is driven by the interaction of the proinflammatory molecule S100A9 with CD33. These 2 proteins formed a functional ligand/receptor pair that recruited components to CD33’s immunoreceptor tyrosine-based inhibition motif (ITIM), inducing secretion of the suppressive cytokines IL-10 and TGF-β by immature myeloid cells. S100A9 transgenic mice displayed bone marrow accumulation of MDSC accompanied by development of progressive multilineage cytopenias and cytological dysplasia. Importantly, early forced maturation of MDSC by either all-trans-retinoic acid treatment or active immunoreceptor tyrosine-based activation motif–bearing (ITAM-bearing) adapter protein (DAP12) interruption of CD33 signaling rescued the hematologic phenotype. These findings indicate that primary bone marrow expansion of MDSC driven by the S100A9/CD33 pathway perturbs hematopoiesis and contributes to the development of MDS.


Figures

Figure 1
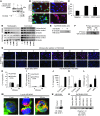
Figure 1. Increased accumulation and function of MDSC in BM of MDS patients.
(A) Percentage of MDSC in the BM-MNC of MDS (n = 12), age-matched healthy (n = 8), and non-MDS cancer specimens (n = 8, P < 0.0001). (B) Chromosome 7 FISH of sorted MDSC or non-MDSC from MDS BM-MNC (n = 5, CEP7 is green and 7q31 orange). 3H-thymidine incorporation (C) and IFN-γ ELISA (D) of stimulated autologous T cells cocultured with sorted MDS-MDSC at 1:0.25 and 1:0.5 ratios (T cells:MDSC). Error bars denote SD of 3 separate patient samples tested in triplicate. (E) BrdU incorporation of stimulated T cells after admixing with autologous unsorted, MDSC depleted (–MDSC), or remixed (+MDSC) BM-MNC. Sorted MDSC from MDS or healthy donor BM tested for IL-10 (F), TGF-β (G), NO (H), and arginase (I) production after 24 hours of culture. (J) MDSC/erythroid precursor contact zone of admixed sorted MDS-MDSC and autologous erythroid precursors at a ratio of 1:3 (MDSC/erythroid precursor) by microscopy at 0 and 30 minutes. Cells were stained for CD71 (pink), CD235a (blue), CD33 (red), and granzyme B (green). (K) Sorted MDSC from MDS or healthy donors labeled with CD33 (red) and granzyme B (green) coincubated with purified autologous erythroid precursors (0 or 30 minutes) and monitored by microscopy. (L) Counts of MDSC-HPC conjugate mobilized granules. Original magnification, ×400 (B); ×600 (J and K). (M) Annexin V exposure on erythroid precursors (CD71+CD235a+) incubated with or without sorted autologous MDS-MDSC. (N) Colony-forming ability of unsorted, –MDSC, or remixed (+MDSC) MDS BM-MNC (ratio of 1:3). *P < 0.005; **P < 0.001; ***P < 0.05.
Figure 2
Figure 2. CD33 signals to enhance MDSC suppressive functions.
(A) BM-MNC from MDS patients (n = 12), age-matched healthy donors (n = 8), and non-MDS cancers (n = 8) were analyzed for CD33’s MFI. *P < 0.0005. (B) Concentration of IL-10, TGF-β, and VEGF from the supernatant of CD33 (or isotype) crosslinked U937 cells. Bars represent mean ± SEM of 3 wells on 3 separate experiments. (C) BM-MNC were isolated from healthy donors and infected with an adenoviral vector containing either GFP (Ad-GFP) or CD33 (Ad-CD33) for 72 hours before flow cytometric analysis of the mature myeloid markers, CD11c, CD80, and CCR7, with noninfected cells as a control (data not shown). (D) BFU and (E) CFU colony-forming assay. After sorting out MDSC from the BM of MDS patients, the remaining MDSC-negative cells were cultured with MDSC that had been mock infected or infected with LV containing nontargeted shRNA or CD33 shRNA (shCD33) for 14 days. The colony formation assay was performed. The MDSC were also cultured for 72 hours after infection with LV containing constructs described above before culturing with MDSC-negative BM cells. *P < 0.001, versus cells treated with control shRNA. The supernatants were collected and assayed for IL-10 (F) and TGF-β (G) by ELISA. *P < 0.05, versus cells treated with control shRNA. (H) The shCD33-treated cells were also analyzed for arginase activity. *P < 0.05, versus cells treated with control shRNA.
Figure 3
Figure 3. Identification of S100A9 as a native ligand for CD33.
(A) Coomassie blue staining of BM lysates precipitated with either control IgG or CD33-fusion. (B) Transfected SJCRH30 cells (S100A8 on top left and S100A9 lower left) stained with CD33-fusion (APC, red). (C) S100A9 capture-ELISA of lysates from untransfected (negative) or S100A9 transfected cells. Secondary antibody was either anti-S100A9 (positive control) or CD33-fusion. (D) Serial dilution of both AD293 and SJCRH30 cell lysates, either untransfected or transfected with vector or S100A9, onto a PVDF membrane and blotted with CD33-fusion. Coomassie blue staining serves as loading control. (E) S100A9 immunoprecipitation of SJCRH30 CD33/S100A9 cotransfected cell lysate blotted against CD33. (F) PBMC and BM-MNC from healthy (H) and MDS (M) samples immunoprecipitated with CD33-fusion and blotted for S100A9. (G) Immunofluorescence staining of rhS100A9-DDK incubated with either CD33-transfected (top) or vector-transfected (bottom) SJCRH30 cells at indicated time points. DAPI = nuclei, APC-DDK = rhS100A9. Treatment of SJCRH30-CD33 cells with rhS100A9 induced IL-10 (H) and TGF-β expression (I). Treatment of U937 cells (high CD33 expression myeloid cell line) with rhS100A9 also induced IL-10 (J) and TGF-β expression (K). S100A9 protein concentration in the plasma of MDS patients (n = 6) measured by ELISA (L). MDS-MDCS treated with 1 μg of rhS100A9 were stained for CD33-FITC and anti-DDK-APC (M) and immunoprecipitated with anti-CD33 antibody followed by blotting with anti–SHP-1 (N). Original magnification, ×400 (B); ×200 (G); ×600 (M). (O) BM plasma from either healthy donors (n = 3) or MDS patients (n = 3) was used to assay SHP-1 recruitment. In all experiments, error bars represent the SEM of 3 separate experiments.
Figure 4
Figure 4. S100A9 signaling through CD33 in MDS BM is associated with MDSC activation and suppressive function.
Healthy BM cells infected with adenovirus containing GFP or CD33 expression vectors assessed by qPCR for the expression of IL-10 (A), TGF-β (C), ARG2 (E), or NOS2 (F), or by ELISA for IL-10 (B) and TGF-β (D). qPCR (G) and flow cytometry of GFP expression (H) determined transfection efficiency. Healthy BM cells’ RAGE, TLR4, CD33, or their combination were blocked prior to culturing cells by themselves or with 1 μg of S100A9 for 48 hours to determine IL-10 gene and protein expression (qPCR in the top and ELISA on the bottom) (I) or TGF-β gene and protein expression (J). (K) Silencing S100A8 and S100A9 expression in primary MDS-BM cells using specific shRNA (demonstrated by Western blot) inhibits the expression of IL-10 (L) and TGF-β (M). *P < 0.01; **P < 0.001, versus cells treated with control shRNA. (N) Blocking S100A8 and S100A9 expression by specific shRNA promotes colony formation in BM cells isolated from patients with MDS. *P < 0.05, versus cells treated with control shRNA. In all experiments, error bars represent the SEM of triplicate determination with 3 separate primary specimens.
Figure 5
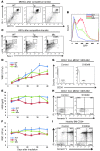
Figure 5. S100A9Tg mice have increased accumulation and activation of MDSC and display dysplastic features that recapitulate human MDS pathology.
(A) Gr1+CD11b+ MDSC accumulation in BM-MNC isolated from S100A9Tg mice at 6, 18, or 24 weeks and S100A9KO or WT mice at both 6 and 24 weeks. (B) Percentage of MDSC from BM, spleen, and PBMC of S100A9Tg mice at 6, 18, and 24 weeks of age by flow cytometry. Spleen cells from B were also assayed against the maturation markers F4/80+Gr1 (C) and I-Ad+ (D). (E) FACS-sorted Gr-1+CD11b+ cells (+MDSC) from the BM of mice described in A remixed back with autologous 1 × 10⁵ MDSC-negative population (containing HSPC, –MDSC) at 1:1 ratio for 14 days before evaluating colony formation. An MDSC-depleted population was used as the control. (F) MDSC from WT, S100A9Tg, and S100A9KO mice were FACS sorted and incubated in a 96-well plate for 24 hours after which IL-10 and TGF-β production were measured by ELISA. Comparison of the hematopathological analysis of WT (GJ) and S100A9Tg mice (KN) Original magnification, ×200 (G and K); ×600 (H and L); ×1000 (J, I, M, and N). Detailed descriptions is in Methods. MDS-BM primary specimens were tested for the location of S100A9 in CD33+ cells (O) and CD34+ cells (P). Flow figures are representative of triplicate experiments.
Figure 6
Figure 6. Mix transplant of S100A9- and WT-enriched HSPC continues effects on hematopoiesis.
(A) Proportion of MDSC in lethally irradiated mice (900 cGy) transplanted with enriched HSPC from WT, S100A9Tg, or a 1:1 mixture of the 2 at 8 weeks (after engraftment). (B) GFP expression of MDSC from the experiments in A. (C) Percentage of KLS stem cells, defined as LineagecKit+Sca-1+, in lethally irradiated mice after transplant with WT, S100A9Tg, or 1:1 mix of enriched HSPC. Proportion and concentration of wbc (D), Hgb (E), and rbc (F) measured weekly by CBC after transplant. Error bars are the SEM of n = 5. (G) Percentage of CD34+ cells in MDSC-depleted MDS-BM specimens treated with or without S100A9 for 48 hours. (H) Same experiment as in G, assessing surface expression of annexin V and PI after treatment with S100A9. (I) Healthy human CD34 cells were treated as in H and cultured for 48 hours followed by annexin V/PI flow cytometric analysis.
Figure 7
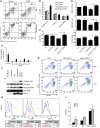
Figure 7. Targeting MDSC activation and signaling can improve suppressive BM microenvironment.
ATRA decreases MDSC in the BM of S100A9Tg mice (A) and promotes the expression of myeloid maturation markers (B). (C) BFU colony formation of WT and S100A9Tg mouse BM cells treated with ATRA. All of the cultures were duplicates. *P < 0.05, between ATRA-treated and vehicle-treated S100A9Tg mice and (D) the number of rbc, wbc, and platelets from CBC analysis of ATRA-treated and untreated mice. *P < 0.05, between ATRA-treated and vehicle-treated S100A9Tg mice. (E) Relative expression levels of DAP12 from isolated MDSC from either healthy or MDS specimens by qPCR (n = 5). (F) AD293 cells were transfected with either vector, WT-DAP12, dominant negative (DN) DAP12, or active DAP12 (P23) for 48 hours and analyzed by Western blot for the expression of phosphorylated or total Syk and ERK. This is representative of 3 independent experiments. MDSC were isolated from the BM of MDS patients and infected with adenoviral vector containing either WT or active DAP12 (P23) for 48 or 72 hours. The surface expression of CD14 or CD15 (G) or the maturation markers CD80, CCR7, and CD11c (H) was then analyzed by flow cytometry. (I) MDSC were purified from BM-MNC of MDS patients by FACS sorting, and cells were infected with LV-WT DAP12 or LV-P23. Colony formation assays were performed in methylcellulose for 14 days. Results are shown as mean ± SEM of 7 patients. *P < 0.01; **P < 0.001, versus cells infected with LV-WT.

References

    1. Allampallam K, et al. Biological significance of proliferation, apoptosis, cytokines, and monocyte/macrophage cells in bone marrow biopsies of 145 patients with myelodysplastic syndrome. Int J Hematol. 2002;75(3):289–297. doi: 10.1007/BF02982044. - DOI - PubMed
    1. Navas T, et al. Inhibition of p38alpha MAPK disrupts the pathological loop of proinflammatory factor production in the myelodysplastic syndrome bone marrow microenvironment. Leuk Lymphoma. 2008;49(10):1963–1975. doi: 10.1080/10428190802322919. - DOI - PMC - PubMed
    1. Stirewalt DL, et al. Tumour necrosis factor-induced gene expression in human marrow stroma: clues to the pathophysiology of MDS? Br J Haematol. 2008;140(4):444–453. doi: 10.1111/j.1365-2141.2007.06923.x. - DOI - PubMed
    1. Kristinsson SY, Björkholm M, Hultcrantz M, Derolf ÅR, Landgren O, Goldin LR. Chronic immune stimulation might act as a trigger for the development of acute myeloid leukemia or myelodysplastic syndromes. J Clin Oncol. 2011;29(21):2897–2903. doi: 10.1200/JCO.2011.34.8540. - DOI - PMC - PubMed
    1. Takizawa H, Boettcher S, Manz MG. Demand-adapted regulation of early hematopoiesis in infection and inflammation. Blood. 2012;119(13):2991–3002. doi: 10.1182/blood-2011-12-380113. - DOI - PubMed

Publication types

MeSH terms