. 2013 Dec;19(12):1609-16.
doi: 10.1038/nm.3385. Epub 2013 Nov 10.

Racial differences in human platelet PAR4 reactivity reflect expression of PCTP and miR-376c

Affiliations

Racial differences in human platelet PAR4 reactivity reflect expression of PCTP and miR-376c

Leonard C Edelstein et al. Nat Med. 2013 Dec.

Abstract

Racial differences in the pathophysiology of atherothrombosis are poorly understood. We explored the function and transcriptome of platelets in healthy black (n = 70) and white (n = 84) subjects. Platelet aggregation and calcium mobilization induced by the PAR4 thrombin receptor were significantly greater in black subjects. Numerous differentially expressed RNAs were associated with both race and PAR4 reactivity, including PCTP (encoding phosphatidylcholine transfer protein), and platelets from black subjects expressed higher levels of PC-TP protein. PC-TP inhibition or depletion blocked PAR4- but not PAR1-mediated activation of platelets and megakaryocytic cell lines. miR-376c levels were differentially expressed by race and PAR4 reactivity and were inversely correlated with PCTP mRNA levels, PC-TP protein levels and PAR4 reactivity. miR-376c regulated the expression of PC-TP in human megakaryocytes. A disproportionately high number of microRNAs that were differentially expressed by race and PAR4 reactivity, including miR-376c, are encoded in the DLK1-DIO3 locus and were expressed at lower levels in platelets from black subjects. These results suggest that PC-TP contributes to the racial difference in PAR4-mediated platelet activation, indicate a genomic contribution to platelet function that differs by race and emphasize a need to consider the effects of race when developing anti-thrombotic drugs.


Figures
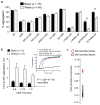
Figure 1
Figure 1
Racial difference in PAR4-mediated platelet aggregation. (a) Mean ± SEM of maximal % aggregation of 70 black and 84 white PRP samples measured by light transmission aggregometry following stimulation with 500 μg ml−1 arachidonic acid (AA), 4 μM ADP, anti-CD9 (500, 750 or 2000 ng ml−1), collagen-related peptide (CRP, 10 or 20 ng ml−1), PAR1-AP (1.0 or 2.5 μM), or PAR4-AP (50 or 75 μM PAR4-AP). *, P < 0.0001, 2-sided Mann-Whitney for maximal % aggregation. Race was the dominant determinant of the PAR4 ARS when we considered the racial differences in age, gender, body mass index (BMI) and platelet count (P=5.15×10⁻⁸, ANOVA partial F statistic of race for PAR ARS, normality of residuals checked by qq-plot). (b) Time to 50% aggregation of washed platelets from black (n=5) and white (n=5) subjects after thrombin activation through PAR4 in the presence of 20 μM of the PAR1-specific antagonist, BMS-200261. P=3.56×10⁻⁵, partial F statistic for race effect using 2-way ANOVA (concentration, race). Insert demonstrates ability of 20 μM BMS to block maximally stimulated PAR1- but not PAR4-induced platelet aggregation. (c) PCA of 2 million genome wide genotype markers demonstrated two groups of PRAX1 subjects that strongly correlated with self-identified race and ethnicity.
Figure 2
Figure 2
Racial differences in human platelet PC-TP expression and function. (a) Mean PCTP mRNA levels are higher in 70 blacks than 84 whites (P=1×10⁻²³, 2-sided t-test). (b) PCR validation of PCTP mRNA. Correlation between microarray and qRT-PCR data using linear regression (SPSS15.0 software). The regression line with its 95% confidence intervals is shown (P<0.0001, Pearson correlation, Fisher’s z transform). (c) Representative western blots showing higher PC-TP levels in platelets from 8 blacks than 8 whites. PC-TP and GAPDH antibodies probed filters that were transferred from the same gel. Image cropped for clarity. (d) Summary of western blot quantification of platelet PC-TP from 70 blacks and 82 whites (P=3.8×10⁻⁶, 2 sided t-test). All samples are derived from the same experiment and processed in parallel. (e) Western blot of mouse platelet Pctp with controls. Image cropped for clarity. (f) Representative aggregometry tracings of platelets in stimulated with PAR1-AP (left) or PAR4-AP (center) with differing concentrations of the PC-TP inhibitor, A1. The bar graph (right) summarizes studies from 3 subjects (2W, 1 B). Compound A1 blocked platelet aggregation to PAR4-AP but not PAR1-AP (P=0.016, 2-sided t-test). Color key for panels f-h shown in panel f. (g) Calcium mobilization in the megakaryocytic cell line, Meg-01 transfected cells with a control siRNA or an siRNA against PCTP after no agonist or stimulation with PAR1-AP (left) or PAR4-AP (right). Curves represent mean ± SEM of three separate experiments for PAR1-AP and four different experiments for PAR4-4P. *, (P=0.013, 2-sided t-test) for the maximum fold change between siRNA-PCTP vs. si-control. (h) Immunoblot of Meg-01 cells transfected with non-targeting siRNA control (si-ctrl) or human PCTP siRNA-SMART pool (si-PCTP). (i) Effect of race on PAR4-AP-mediated platelet calcium mobilization (P=0.02, 2-way ANOVA).
Figure 3
Figure 3
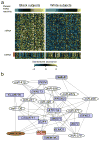
Relationships among racial differences in PAR4 phenotype and transcripts. (a) Racial differences between 70 blacks and 84 whites for PAR4 reactivity, mRNAs and miRNAs are presented in 3 heatmaps. Each column represents data from the same individual. Rows represent 93 mRNAs (in middle panel) and 18 miRNAs (lower panel) that are DE by race and correlated with PAR4 reactivity. Vertical red bar indicates strongly correlated DLK1-DIO3 region miRNAs. (b) Network of miRNA-mRNA pairs that are differentially expressed by race and PAR4-mediated platelet aggregation.
Figure 4
Figure 4
MiR-376c regulates PCTP expression in megakaryocytes. (a) Transfection of miR-376c diminishes PC-TP protein expression in Dicer-low HCT cells. *, P<0.05. (b) Transfection of miR-376c diminishes PC-TP protein expression in the megakaryocytic cell line, Meg-01. (c) Transfection of miR-376c locked nucleic acid (LNA) inhibitor increased PCTP mRNA levels, while overexpression of the miR-376c precursor decreased PCTP mRNA in megakaryocytic cell lines, Meg-01 and HEL cells. P-value calculation is T-test relative to appropriate scrambled control. Levels were normalized to β-actin. (d) Demonstration of human CD34+ hematopoietic stem cell derived megakaryocytes. Flow cytometric analysis of CD34+ cells cultured for 4 and 12 d and stained for megakaryocyte-specific markers CD41 and CD42. (e) 14 d megakaryocytes showing proplatelet formation with DNA (DAPI, purple-blue), α-tubulin (green) and actin (red) staining. (f) qRT-PCR quantification of PCTP in 14 d CD61+ 14 d megakaryocytes, transfected with miR-376c locked nucleic acid (LNA) inhibitor or pre-miR-376. Levels were normalized to β-actin. (g) Activity of a luciferase reporter with the 3′UTR of PCTP with a wild type (WT PCTP) or mutated miR-376c (ΔPCTP) target site. Only the WT construct was knocked down when co-transfected with miR-376 precursor. Levels were normalized with a β-gal control.
Figure 5
Figure 5
A large miRNA cluster in the DLK1-DIO3 region is differentially expressed by race. (a) Heatmap of Pearson’s correlation coefficients amongst all combinations of pairs of the 178 commonly expressed platelet miRNAs. (b) The approximate locations of the 54 miRNAs in the DLK1-DIO3 region. Color coding indicates which miRNA genes had at least one mature miRNA product detected above or below the arbitrary threshold of commonly expressed miRNAs and the four miRNA genes that were not queried. Figure not to scale. (c) Each dot represents the average expression of one of the 24 DLK1-DIO3 region miRNAs above cutoff. Using a binomial model, the chance that all 24 of the expressed DLK1-DIO3 miRNAs would be higher in whites is 1.2 × 10⁻²⁴ based on a genome-wide (excluding the DLK1-DIO3 region) rate of 51.4% of DE miRNAs higher in whites. (d) A schematic summarizing the relationship of race with the expression of the DLK1-DIO3 region miRNAs and target mRNAs and PAR4 reactivity.

References

    1. Libby P. Mechanisms of acute coronary syndromes and their implications for therapy. The New England journal of medicine. 2013;368:2004–2013. - PubMed
    1. Leger AJ, Covic L, Kuliopulos A. Protease-activated receptors in cardiovascular diseases. Circulation. 2006;114:1070–1077. - PubMed
    1. Abrams CS, Brass LF. Platelet Signal Transduction. In: Colman RW, Hirsh J, Marder VJ, Clowes AW, George JN, editors. Hemostasis and thrombosis: basic principles and clinical practice. Lippincott Williams & Wilkins; Philadelphia, PA: 2006. pp. 617–629.
    1. Macfarlane SR, Seatter MJ, Kanke T, Hunter GD, Plevin R. Proteinase-activated receptors. Pharmacol Rev. 2001;53:245–282. - PubMed
    1. Lova P, et al. Contribution of protease-activated receptors 1 and 4 and glycoprotein Ib-IX-V in the G(i)-independent activation of platelet Rap1B by thrombin. The Journal of biological chemistry. 2004;279:25299–25306. - PubMed

Publication types

Associated data