. 2013 Dec;19(12):1617-24.
doi: 10.1038/nm.3282. Epub 2013 Nov 10.

Targeting of αv integrin identifies a core molecular pathway that regulates fibrosis in several organs

Affiliations

Targeting of αv integrin identifies a core molecular pathway that regulates fibrosis in several organs

Neil C Henderson et al. Nat Med. 2013 Dec.

Abstract

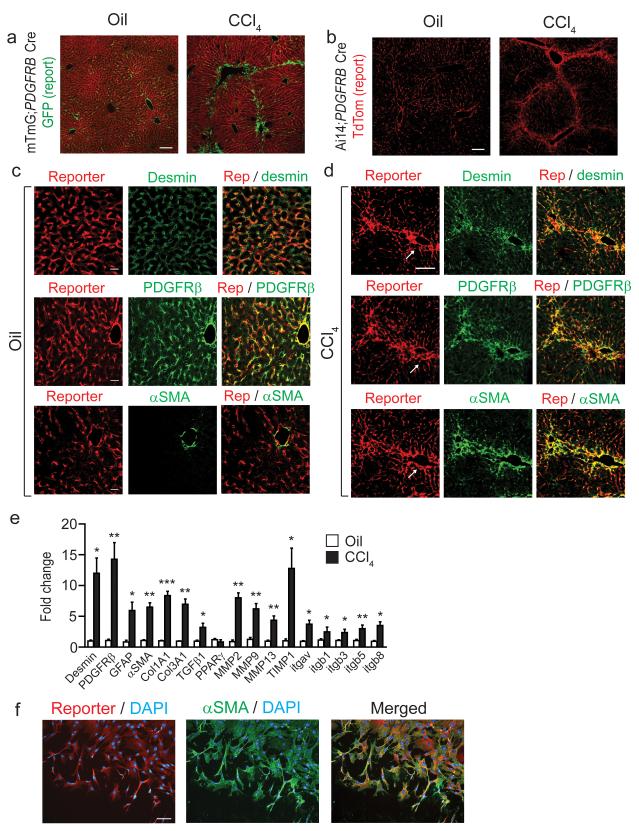
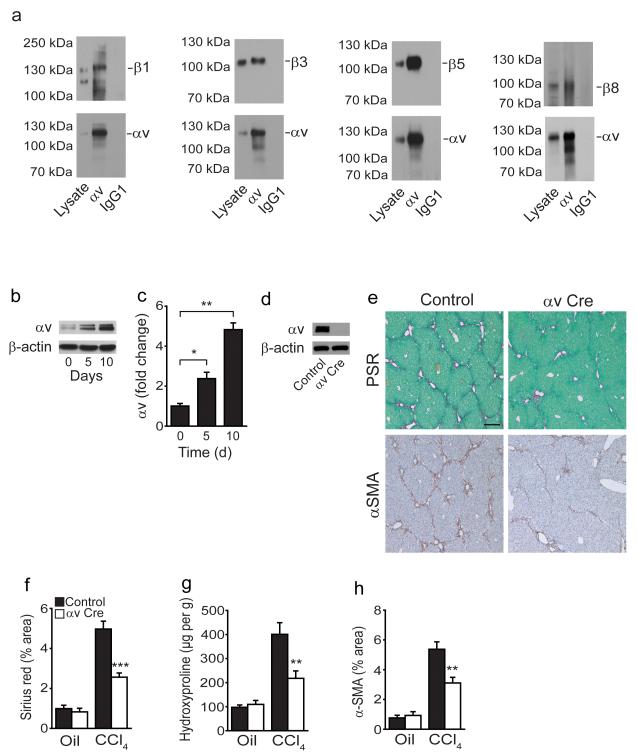
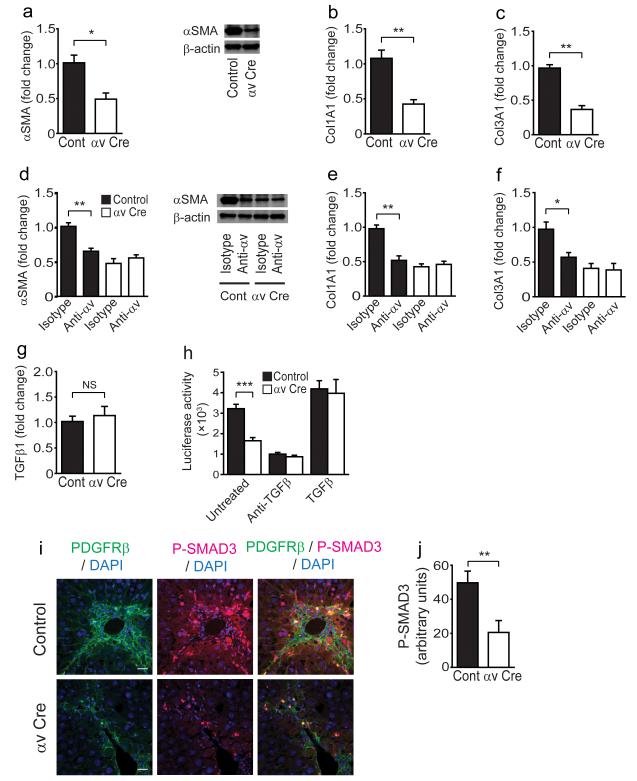
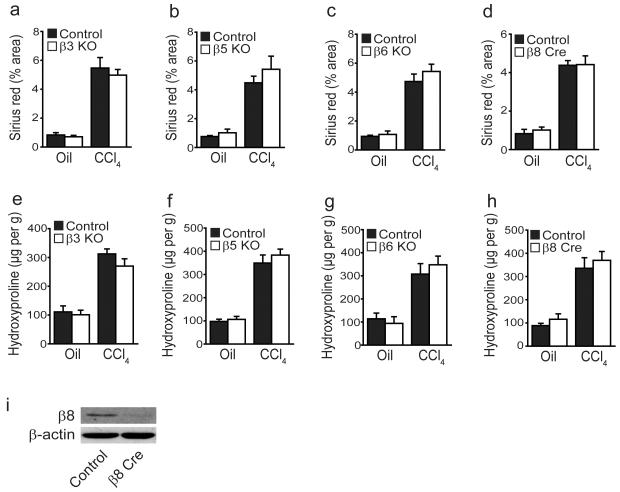
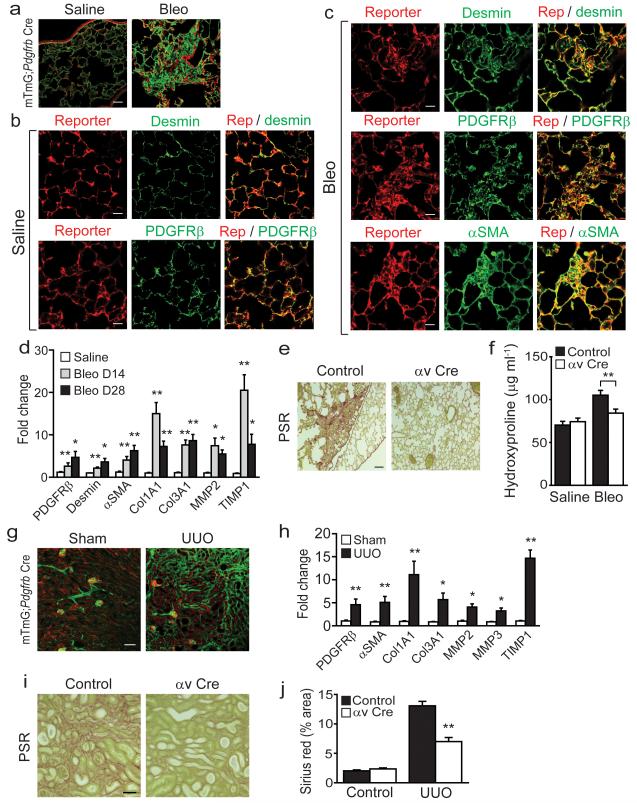
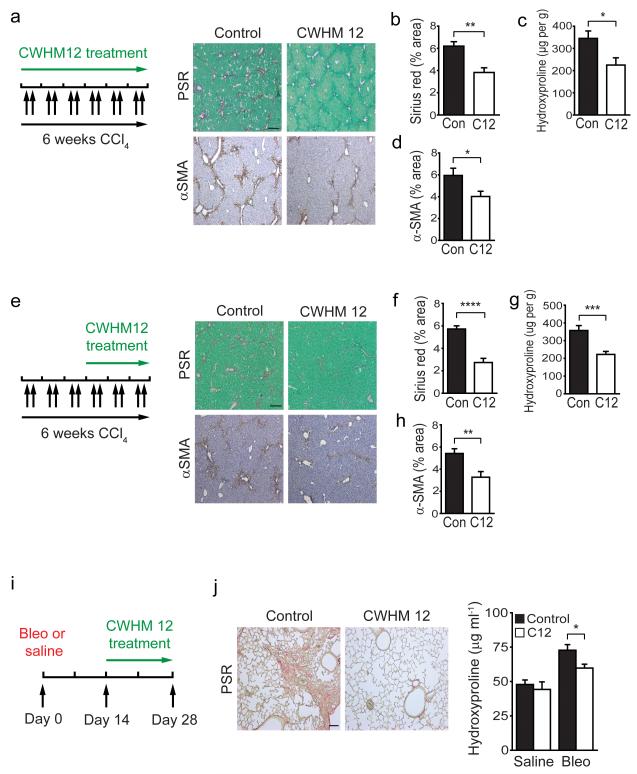
Myofibroblasts are the major source of extracellular matrix components that accumulate during tissue fibrosis, and hepatic stellate cells (HSCs) are believed to be the major source of myofibroblasts in the liver. To date, robust systems to genetically manipulate these cells have not been developed. We report that Cre under control of the promoter of Pdgfrb (Pdgfrb-Cre) inactivates loxP-flanked genes in mouse HSCs with high efficiency. We used this system to delete the gene encoding α(v) integrin subunit because various α(v)-containing integrins have been suggested as central mediators of fibrosis in multiple organs. Such depletion protected mice from carbon tetrachloride-induced hepatic fibrosis, whereas global loss of β₃, β₅ or β₆ integrins or conditional loss of β₈ integrins in HSCs did not. We also found that Pdgfrb-Cre effectively targeted myofibroblasts in multiple organs, and depletion of the α(v) integrin subunit using this system was protective in other models of organ fibrosis, including pulmonary and renal fibrosis. Pharmacological blockade of α(v)-containing integrins by a small molecule (CWHM 12) attenuated both liver and lung fibrosis, including in a therapeutic manner. These data identify a core pathway that regulates fibrosis and suggest that pharmacological targeting of all α(v) integrins may have clinical utility in the treatment of patients with a broad range of fibrotic diseases.


Figures

Figure 1
Figure 1. Pdgfrb-Cre effectively targets recombination in quiescent and activated hepatic stellate cells
(a,b) Immunofluoresence micrographs of liver sections harvested from control (olive oil treated) or chronic CCl4 treated (x2 injections / week for six weeks) mTmG;Pdgfrb-Cre reporter mice or Ai14;Pdgfrb-Cre reporter mice (n = 4 male mice per group). Scale bars, 100 μm. (c,d) Immunofluoresence micrographs of liver sections from control (olive oil treated) (c) or CCl4 treated (d) Ai14;Pdgfrb-Cre mice (n = 4 male mice per group) stained for desmin, PDGFRβ or αSMA (green) with endogenous (not enhanced) Ai14-Td tomato report in red. (c) Scale bars, 25 μm. (d) Scale bar, 50 μm. Arrows indicate portal tracts in serial sections. (e) Gene expression profile of freshly sorted Td tomato positive cells from control (olive oil treated) or chronic CCl4 treated Ai14;Pdgfrb-Cre mice (n = 4 male mice per group). (f) Immunofluoresence staining of Td tomato positive cells sorted from the uninjured livers of Ai14;Pdgfrb-Cre mice and plated on tissue culture plastic for 7 days. Left panel shows Ai14 reporter (red), DAPI (blue), middle panel shows αSMA (green), DAPI (blue), right panel shows merged image. Scale bar, 100μm. Data are mean ± s.e.m. *P < 0.05, **P < 0.01, ***P < 0.001 (Student’s t test).
Figure 2
Figure 2. Depletion of the αv integrin on hepatic stellate cells protects mice from CCl4-induced hepatic fibrosis
(a) Co-immunoprecipitation studies: Sorted Td tomato positive cells from uninjured livers of Ai14;Pdgfrb-Cre mice cultured for 7 days express αvβ1, αvβ3, αvβ5 and αvβ8. (b) Western blot and (c) qPCR analysis demonstrates induction of αv integrin expression during transition from the quiescent (day 0) to the culture activated phenotype (day 5,10) in wild type HSCs. (d) Western blotting of αv expression in control and itgavflox/flox;Pdgfrb-Cre (αv Cre) HSCs culture activated for 5 days. (e) Picrosirius red staining (collagen deposition) (upper panels) and αSMA immunohistochemistry (lower panels) of liver tissue after olive oil or chronic CCl4 treatment of control and itgavflox/flox;Pdgfrb-Cre mice (n = 8 male mice per group). Scale bar, 200μm. (f) Digital image analysis quantification of collagen staining. (g) Hydroxyproline analysis. (h) Digital image analysis quantification of αSMA staining. Data are mean ± s.e.m. *P < 0.05, **P < 0.01, ***P < 0.001 (Student’s t test).
Figure 3
Figure 3. αv integrin depletion on hepatic stellate cells inhibits pro-fibrotic gene expression via a reduction in transforming growth factor beta (TGF-β) activation
(a) qPCR (left panel) and western blot analysis of αSMA expression (right panel) in control and itgavflox/flox;Pdgfrb-Cre (αv Cre) HSCs culture activated for 5 days. (b,c) qPCR analysis of Col1A1 and Col3A1 expression in control and itgavflox/flox;Pdgfrb-Cre (αv Cre) HSCs culture activated for 5 days. (d) qPCR (left panel) and western blot analysis of αSMA expression (right panel) in control and itgavflox/flox;Pdgfrb-Cre HSCs treated with 20 μg ml−1 isotype control or αv integrin specific (clone RMV-7) antibodies for 5 days post plating. (e,f) qPCR analysis of Col1A1 and Col3A1 expression in control and itgavflox/flox;Pdgfrb-Cre HSCs treated with 20 μg ml−1 isotype control or αv integrin specific (clone RMV-7) antibodies for 5 days post plating. (g) qPCR analysis of Tgfb1 expression in control and itgavflox/flox;Pdgfrb-Cre HSCs culture activated for 5 days. (h) TGF-β activation by control or itgavflox/flox;Pdgfrb-Cre HSCs alone, or in the presence of TGF-β blocking antibody (clone 1D11, 40 μg ml−1) or activated TGF-β (300 pg ml−1). (i) Immunofluoresence micrographs of liver sections from control and itgavflox/flox;Pdgfrb-Cre mice following chronic CCl4 treatment (n = 8 male mice per group). Scale bars, 25 μm. (j) Digital image analysis quantification of phospho-SMAD3 staining. Data are mean ± s.e.m. *P < 0.05, **P < 0.01, ***P < 0.001 (Student’s t test).
Figure 4
Figure 4. Global loss of αvβ3, αvβ5 or αvβ6 or conditional loss of αvβ8 on hepatic stellate cells does not protect mice from CCl4-induced hepatic fibrosis
(a–d) Digital image analysis quantification of collagen staining in control and β3 KO, β5 KO, β6 KO and itgb8flox/flox;Pdgfrb-Cre (β8 Cre) mice (n = 6 male mice per group) after control (olive oil) or chronic CCl4 treatment (x2 injections / week for 6 weeks). (e–h) Hydroxyproline analysis of liver tissue from control and β3 KO, β5 KO, β6 KO and itgb8flox/flox;Pdgfrb-Cre mice. (i) Western blotting of integrin β8 subunit expression in control and itgb8flox/flox;Pdgfrb-Cre HSCs culture activated for 7 days.
Figure 5
Figure 5. Pdgfrb-Cre-mediated depletion of the αv integrin is protective in multiple models of solid organ fibrogenesis
(a) Immunofluoresence micrographs of lung sections from saline treated (left panel) or bleomycin treated (right panel) mTmG;Pdgfrb-Cre mice (n = 4 female mice per group) 28 days after instillation. Scale bar, 50 μm. (b,c) Immunofluoresence micrographs of lung sections from saline treated (b) or bleomycin treated (c) Ai14;Pdgfrb-Cre mice (n = 4 female mice per group). Scale bars, 25 μm. (d) Gene expression profile of freshly sorted Td tomato positive cells from saline treated (28 days post instillation) or bleomycin treated (14 or 28 days post instillation) Ai14;Pdgfrb-Cre mice (n = 4 female mice per group). (e) Picrosirius red staining of lung tissue 28 days after bleomycin instillation in control and itgavflox/flox;Pdgfrb-Cre (αv Cre) mice (n = 12 female mice per group). Scale bar, 100μm. (f) Hydroxyproline analysis of lung tissue. (g) Immunofluoresence micrographs of left kidney sections from mTmG;Pdgfrb-Cre mice (n = 4 male mice per group) following sham operation or unilateral ureteric obstruction (UUO) for 14 days. Scale bar, 100 μm. (h) Gene expression profile of freshly sorted Td tomato positive cells from sham operated or UUO (day 7) Ai14;Pdgfrb-Cre mice (n = 4 male mice per group). (i) Picrosirius red staining of kidney tissue 14 days after UUO in control and itgavflox/flox;Pdgfrb-Cre mice (n = 6 male mice per group). Scale bar, 100μm. (j) Digital image analysis of collagen staining. Data are mean ± s.e.m. *P < 0.05, **P < 0.01 (Student’s t test).
Figure 6
Figure 6. Blockade of αv integrins by a novel small molecule (CWHM 12) attenuates liver and lung fibrosis
(a) Dosing regime in the prophylactic liver fibrosis model (left panel). Alzet minipumps containing CWHM 12 or vehicle were inserted, followed by CCl4 I.P. twice weekly for 6 weeks. Picrosirius red (upper) and αSMA immunohistochemistry (lower) of liver tissue from control and CWHM 12 treated mice (n = 6 female mice per group) after chronic CCl4 treatment. Scale bar, 200μm. (b) Digital image analysis of picrosirius red staining. (c) Hydroxyproline analysis. (d) Digital image analysis of αSMA staining. (e) Dosing regime in the therapeutic liver fibrosis model (left panel). Mice were given CCl4 I.P. twice weekly for 3 weeks, then Alzet minipumps containing either CWHM 12 or vehicle were inserted, followed by a further 3 weeks of CCl4 I.P. twice weekly. Picrosirius red (upper) and αSMA immunohistochemistry (lower) of liver tissue from control and CWHM 12 treated mice (n =14 female mice per group) after chronic CCl4 treatment. Scale bar, 200μm. (f) Digital image analysis of picrosirius red staining. (g) Hydroxyproline analysis. (h) Digital image analysis of αSMA staining. (i) Dosing regime in the therapeutic lung fibrosis model. Alzet minipumps containing either CWHM 12 or vehicle were inserted 14 days after treatment with bleomycin or saline, and lungs were harvested at 28 days. (j) Picrosirius red staining of lung tissue from control and CWHM 12 treated mice 28 days after bleomycin instillation (n = 15 female mice per group). Scale bar, 100μm (left panel). Hydroxyproline analysis (right panel). Data are mean ± s.e.m. *P < 0.05, **P < 0.01, ***P < 0.001, ****P < 0.0001 (Student’s t test).

Comment in

References

    1. Gleizes PE, et al. TGF-beta latency: biological significance and mechanisms of activation. Stem Cells. 1997;15:190–197. - PubMed
    1. Munger JS, et al. Latent transforming growth factor-beta: structural features and mechanisms of activation. Kidney Int. 1997;51:1376–1382. - PubMed
    1. Munger JS, et al. The integrin αvβ6 binds and activates latent TGFβ1: a mechanism for regulating pulmonary inflammation and fibrosis. Cell. 1999;96:319–328. - PubMed
    1. Mu D, et al. The integrin alpha(v)beta8 mediates epithelial homeostasis through MT1-MMP-dependent activation of TGF-beta1. J. Cell. Biol. 2002;157:493–507. - PMC - PubMed
    1. Annes JP, Rifkin DB, Munger JS. The integrin alphaVbeta6 binds and activates latent TGFbeta3. FEBS Lett. 2002;511:65–68. - PubMed

Publication types

MeSH terms

Substances

LinkOut - more resources