. 2013 Dec;24(11-12):446-58.
doi: 10.1007/s00335-013-9484-9. Epub 2013 Nov 13.

Genetic factors involved in risk for methamphetamine intake and sensitization

Affiliations

Genetic factors involved in risk for methamphetamine intake and sensitization

John K Belknap et al. Mamm Genome. 2013 Dec.

Abstract

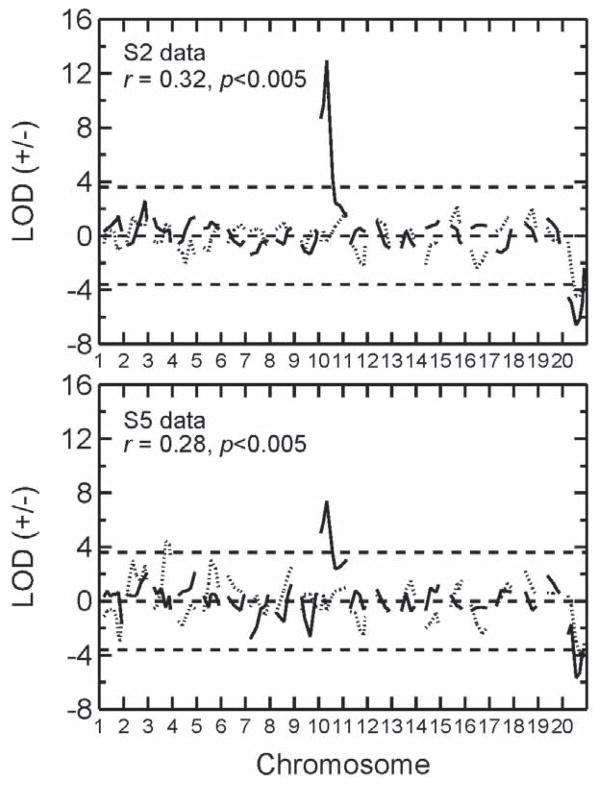
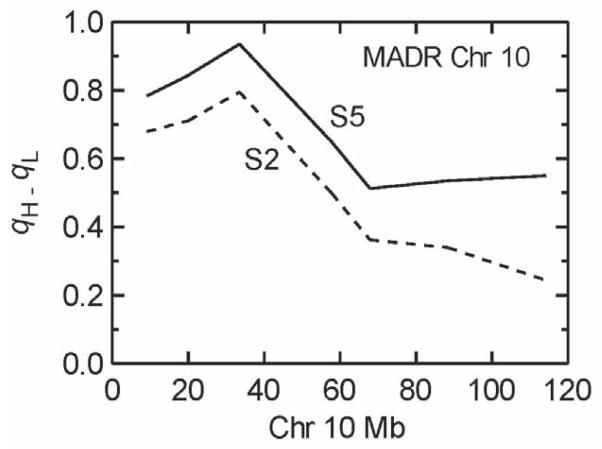
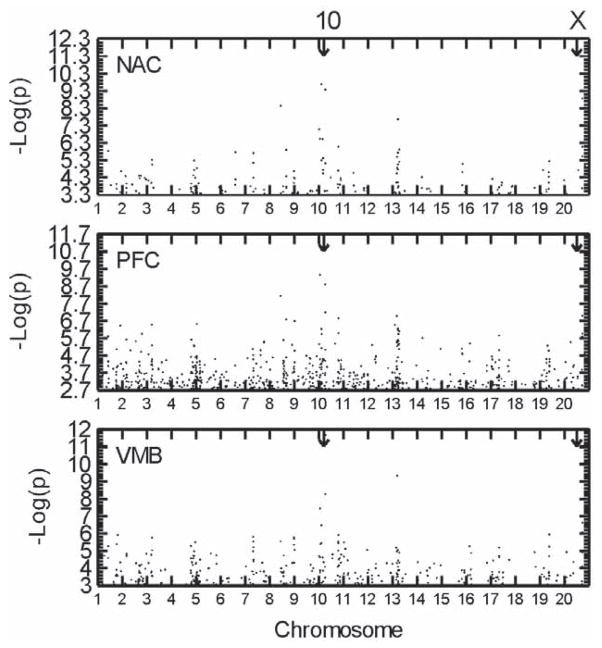
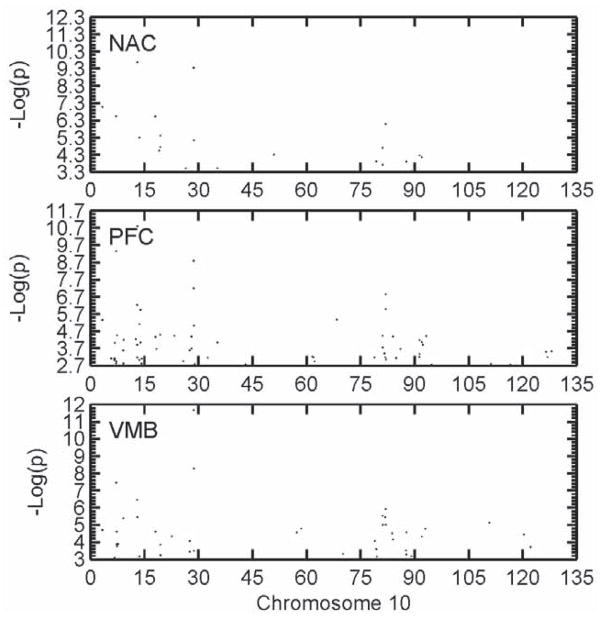
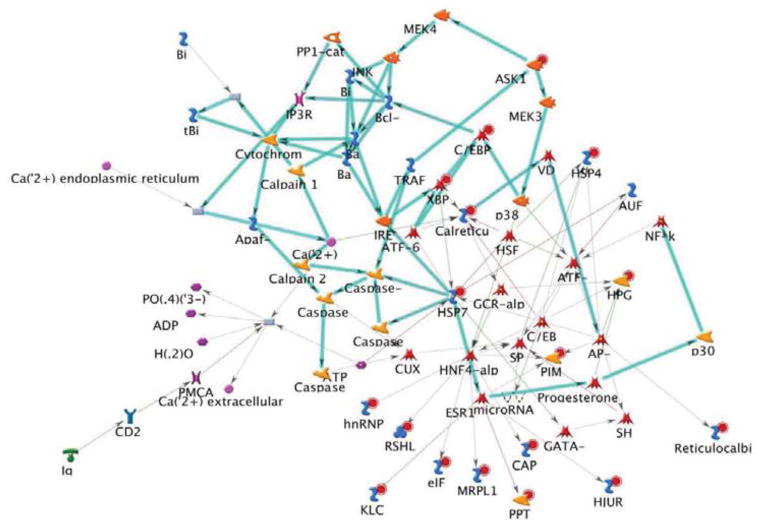
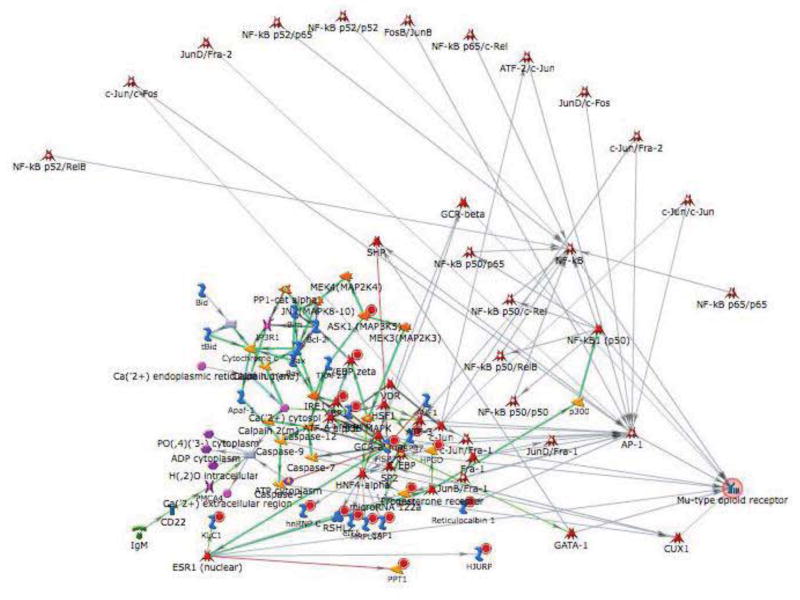
Lines of mice were created by selective breeding for the purpose of identifying genetic mechanisms that influence the magnitude of the selected trait and to explore genetic correlations for additional traits thought to be influenced by shared mechanisms. DNA samples from high and low methamphetamine-drinking (MADR) and high and low methamphetamine-sensitization lines were used for quantitative trait locus (QTL) mapping. Significant additive genetic correlations between the two traits indicated a common genetic influence, and a QTL on chromosome X was detected for both traits, suggesting one source of this commonality. For MADR mice, a QTL on chromosome 10 accounted for more than 50 % of the genetic variance in that trait. Microarray gene expression analyses were performed for three brain regions for methamphetamine-naïve MADR line mice: nucleus accumbens, prefrontal cortex, and ventral midbrain. Many of the genes that were differentially expressed between the high and low MADR lines were shared in common across the three brain regions. A gene network highly enriched in transcription factor genes was identified as being relevant to genetically determined differences in methamphetamine intake. When the mu opioid receptor gene (Oprm1), located on chromosome 10 in the QTL region, was added to this top-ranked transcription factor network, it became a hub in the network. These data are consistent with previously published findings of opioid response and intake differences between the MADR lines and suggest that Oprm1, or a gene that impacts activity of the opioid system, plays a role in genetically determined differences in methamphetamine intake.


Figures

Figure 1
Figure 1
Directional genome-wide LOD scores resulting from QTL analysis for the MADR (solid line) and MASENS (dotted line) short-term selected lines in the S2 and S5 generations. Positive LOD scores indicate that the D2 strain allele confers higher trait scores, while negative LOD scores indicate that the B6 allele confers higher trait scores. The genetic correlation between the two traits is also shown, indicating a statistically significant degree of genetic codetermination between the two behavioral traits in both generations. Horizontal dashed lines indicate genome-wide significance threshold based on permutation tests (Doerge and Churchill, 1996).
Figure 2
Figure 2
Difference in allele frequencies between the two oppositely-selected MADR lines, qH - qL, for all markers on Chr 10 where the largest QTL was found. The S2 and S5 generations are shown indicating increasing allele frequency divergence as a function of generation of selection, especially for the proximal portion of this chromosome where the QTL resides. There is a suggestion of a second QTL at the distal end of Chr 10, but this did not meet our statistical criteria for being significant.
Figure 3
Figure 3
Genome-wide distribution of differentially expressed (DE) probe sets between the MAHDR and MALDR lines that attained FDR < 0.05 for each of the three brain areas, either nucleus accumbens (NAC), prefrontal cortex (PFC) or ventral midbrain (VMB). As can be seen, the clustering of DE probe sets in particular chromosomal locations was closely similar for all three brain areas although the probe sets making up each cluster often were not the same. The arrows show the locations of the two significant QTLs for the MA preference drinking trait on Chr 10 and X. The X axis in all cases is the negative logarithm of the p value for the line difference.
Figure 4
Figure 4
The distribution of differentially expressed (DE) probe sets on Chr 10 between the MAHDR and MALDR lines that attained FDR < 0.05 for each of the three brain areas, either nucleus accumbens (NAC), prefrontal cortex (PFC) or ventral midbrain (VMB). As can be seen, the clustering of DE probe sets in particular chromosomal locations was closely similar for all three brain areas although the probe sets making up each cluster often did not agree. The QTL influencing the MADR trait was on proximal Chr 10, with a 2-LOD support interval ranging from 10 to 40 Mb; however, the lack of markers at the most proximal end (centromere) impacts the ability to exclude this region. The X axis in all cases was the negative logarithm of the p value for the line difference.
Figure 5
Figure 5
Results of comparative network analysis conducted on differentially expressed genes in 3 brain regions (nucleus accumbens, prefrontal cortex and ventral midbrain) identifies a network rich in transcription factor genes (p = 1.87e-40). Shown are inferred functional characteristics of genes that were differentially expressed between the high and low methamphetamine drinking selected lines.
Figure 6
Figure 6
Candidate gene Oprm1 (mu-type opioid receptor) becomes a hub when added to the top ranked transcription factor network of genes that show differential expression in the nucleus accumbens, prefrontal cortex and ventral midbrain of methamphetamine naïve high and low methamphetamine drinking line mice.

References

    1. Belknap JK, Hitzemann R, Crabbe JC, Phillips TJ, Buck KJ, Williams RW. QTL analysis and genomewide mutagenesis in mice: complementary genetic approaches to the dissection of complex traits. Behav Genet. 2001;31:5–15. - PubMed
    1. Belknap JK, Mitchell SR, O’Toole LA, Helms ML, Crabbe JC. Type I and type II error rates for quantitative trait loci (QTL) mapping studies using recombinant inbred mouse strains. Behav Genet. 1996;26:149–160. - PubMed
    1. Belknap JK, Richards SP, O’Toole LA, Helms ML, Phillips TJ. Short-term selective breeding as a tool for QTL mapping: Ethanol preference drinking in mice. Behav Genet. 1997;27:55–66. - PubMed
    1. Benjamini Y, Hochberg Y. Controlling the false discovery rate: a practical and powerful approach to multiple testing. J R Stat Soc B. 1995;57:289–300.
    1. Boone EM, Hawks BW, Li W, Garlow SJ. Genetic regulation of hypothalamic cocaine and amphetamine-regulated transcript (CART) in BxD inbred mice. Brain Res. 2008;1194:1–7. - PMC - PubMed

Publication types