. 2013 Nov;27(6):504-10.
doi: 10.1002/jcla.21634.

Hepcidin-25 concentrations are markedly increased in patients with chronic kidney disease and are inversely correlated with estimated glomerular filtration rates

Affiliations

Hepcidin-25 concentrations are markedly increased in patients with chronic kidney disease and are inversely correlated with estimated glomerular filtration rates

Jason S Troutt et al. J Clin Lab Anal. 2013 Nov.

Abstract

Background: Hepcidin-25 regulates iron homeostasis by binding the iron transporter ferroportin, causing its degradation. Increased hepcidin-25 causes decreased intestinal iron absorption and release from intracellular stores. Our objective in this study was to measure hepcidin-25 levels in patients with chronic kidney disease (CKD) to determine if they might contribute to the anemia of CKD.

Methods: We used a hepcidin-25-specific enzyme-linked immunosorbent assay to measure hepcidin-25 in 103 CKD patients and 100 healthy individuals. We assessed in CKD subjects the correlation of hepcidin-25 with creatinine, estimated glomerular filtration rate (eGFR), hemoglobin, blood urea nitrogen, serum iron, transferrin, and ferritin.

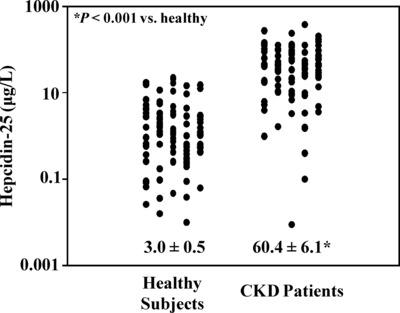
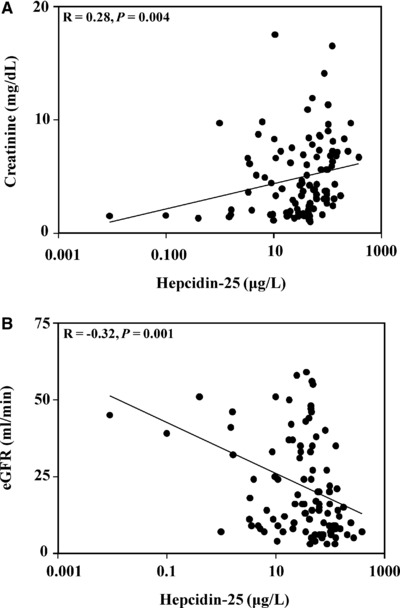
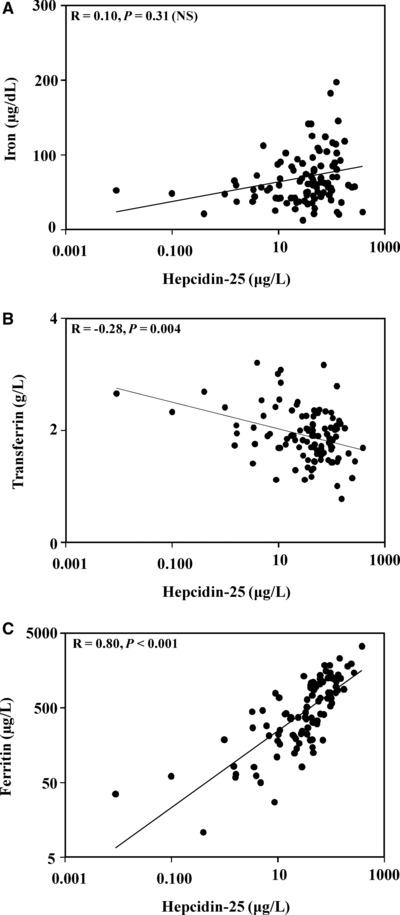
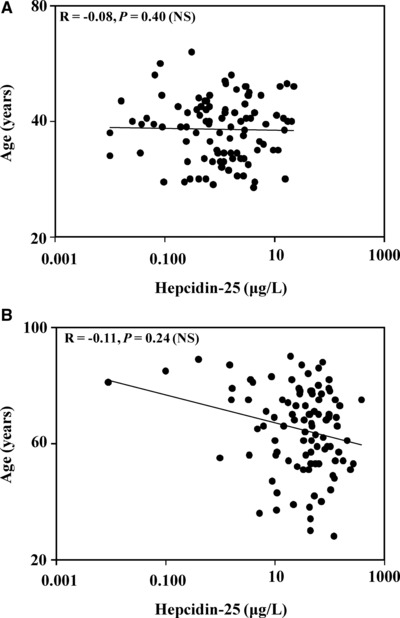
Results: Hepcidin-25 concentrations in CKD patients were significantly increased compared to healthy subjects (60.4 ± 6.1 μg/l vs. 3.0 ± 0.5 μg/l, P < 0.001). Hepcidin-25 concentrations were directly correlated with creatinine (R = 0.28, P = 0.004) and inversely correlated with eGFR (R = -0.32, P = 0.001). Hepcidin-25 levels were also correlated with transferrin (R = -0.28, P = 0.004) and ferritin (R = 0.80, P < 0.001).

Conclusion: The direct correlation of hepcidin-25 with creatinine and its inverse correlation with eGFR suggest that hepcidin-25 levels increase as renal function deteriorates, possibly due to decreased hepcidin-25 renal clearance.

Keywords: anemia; ferritin; hepcidin; immunoassay; iron.


Figures

Figure 1
Figure 1
Serum hepcidin‐25 concentrations in CKD patients and normal subjects—serum samples from 100 healthy subjects and 103 patients with CKD were analyzed for hepcidin‐25 concentrations. Results are plotted as individual points with the mean ± SEM also shown. Serum hepcidin‐25 concentrations in patients with CKD were significantly increased compared to healthy subjects (60.4 ± 6.1 μg/l vs. 3.0 ± 0.5 μg/l, P < 0.001).
Figure 2
Figure 2
Relationship between hepcidin‐25, creatinine, and eGFR in patients with CKD. (A) Serum hepcidin‐25 and creatinine concentrations were compared in CKD patients. Hepcidin‐25 concentrations were directly correlated with creatinine levels (R = 0.28, P = 0.004). (B) Serum hepcidin‐25 concentrations and eGFR were compared in CKD patients. The two measures were significantly inversely correlated in the CKD patients (R = −0.32, P = 0.001).
Figure 3
Figure 3
Comparison of hepcidin‐25 and hemoglobin in patients with CKD—serum hepcidin‐25 and blood hemoglobin concentrations were examined in patients with CKD. Results are plotted for patients with stage 5 CKD (open circles), stage 4 CKD (solid circles), and stage 3 CKD (solid triangles). There was no significant correlation between hepcidin‐25 and hemoglobin for any CKD stage (R = −0.14, P = 0.32 for stage 5; R = −0.33, P = 0.11 for stage 4; R = −0.12, P = 0.52 for stage 3).
Figure 4
Figure 4
Relationship between hepcidin‐25 and iron, transferrin, and ferritin in patients with CKD. (A) Hepcidin‐25 and serum iron levels in CKD patients were compared. There was no significant correlation between the two (R = 0.10, P = 0.31). (B) Hepcidin‐25 and transferrin levels in CKD patients were compared. The two analytes were inversely correlated (R = −0.28, P = 0.004). (C) Hepcidin‐25 and serum ferritin levels in CKD patients were compared. Hepcidin‐25 was directly correlated with serum ferritin concentrations (R = 0.80, P < 0.001).
Figure 5
Figure 5
Comparison of age and hepcidin‐25 concentrations in normal subjects and in patients with CKD. (A) Hepcidin‐25 and age were compared in the normal subjects. There was no significant correlation between the two (R = −0.08, P = 0.40). (B) Hepcidin‐25 and age in CKD patients were compared. There was no significant correlation between the two (R = −0.11, P = 0.24).

References

    1. Nicolas G, Bennoun M, Devaux I, et al. Lack of hepcidin gene expression and severe tissue iron overload in upstream stimulatory factor 2 (USF2) knockout mice. Proc Natl Acad Sci USA 2001;98:8780–8785. - PMC - PubMed
    1. Ganz T. Molecular control of iron transport. J Am Soc Nephrol 2007;18:394–400. - PubMed
    1. De Domenico I, Ward DM, Langelier C, et al. The molecular mechanism of hepcidin‐mediated ferroportin down‐regulation. Mol Biol Cell 2007;18:2569–2578. - PMC - PubMed
    1. Nemeth E, Preza GC, Jung CL, Kaplan J, Waring AJ, Ganz T. The N‐terminus of hepcidin is essential for its interaction with ferroportin: Structure‐function study. Blood 2006;107:328–333. - PMC - PubMed
    1. Rivera S, Nemeth E, Gabayan V, Lopez MA, Farshidi D, Ganz T. Synthetic hepcidin causes rapid dose‐dependent hypoferremia and is concentrated in ferroportin‐containing organs. Blood 2005;106:2196–2199. - PMC - PubMed