. 2013 Nov 18;210(12):2755-71.
doi: 10.1084/jem.20131539. Epub 2013 Nov 11.

The distinctive germinal center phase of IgE+ B lymphocytes limits their contribution to the classical memory response

Affiliations

The distinctive germinal center phase of IgE+ B lymphocytes limits their contribution to the classical memory response

Jin-Shu He et al. J Exp Med. .

Abstract

The mechanisms involved in the maintenance of memory IgE responses are poorly understood, and the role played by germinal center (GC) IgE(+) cells in memory responses is particularly unclear. IgE(+) B cell differentiation is characterized by a transient GC phase, a bias toward the plasma cell (PC) fate, and dependence on sequential switching for the production of high-affinity IgE. We show here that IgE(+) GC B cells are unfit to undergo the conventional GC differentiation program due to impaired B cell receptor function and increased apoptosis. IgE(+) GC cells fail to populate the GC light zone and are unable to contribute to the memory and long-lived PC compartments. Furthermore, we demonstrate that direct and sequential switching are linked to distinct B cell differentiation fates: direct switching generates IgE(+) GC cells, whereas sequential switching gives rise to IgE(+) PCs. We propose a comprehensive model for the generation and memory of IgE responses.


Figures

Figure 1.
Figure 1.
CεGFP mice efficiently report all CSR to Cε. (A) Schematic representation of CεGFP KI integration into the IgH Cε locus. (B–H) CεGFP BALB/c mice were infected with N. brasiliensis and mLNs were collected 10 d later for analysis by flow cytometry and sorting. (B) Left: frequency of GFP+ cells among total lymphocytes; middle: CD95 expression on GFP+ cells and GFPB220+ cells; right: frequency of IgE+ and IgG1+ cells within the gated GFP+ population. (C) QPCR analysis of Cε switched (left) and mature (right) transcripts in sorted IgE+GFP+, IgG1+GFP+, and IgG1+GFPB220+ cells. Error bars indicate SD of duplicated samples. Data are representative of two independent experiments with n = 3 mice pooled per experiment. (D) Schematic representation of mature Cε and switched Cε transcripts driving GFP expression from the productive and nonproductive IgH alleles. (E) Numbers indicate frequency of B220loCD138+ PC and B220+CD138 GC cells among gated IgE+GFP+, IgG1+GFP+, and IgG+GFP cells. (F and G) IgE+ and IgG1+ LN cells from day 10 N. brasiliensis CεGFP BALB/c-infected mice were sorted into B220loCD138+ PC and B220+CD138 GC cell populations. Naive B220+FASIgG1IgE cells were sorted as a control reference population. Gene expression was analyzed using the Affymetrix Mouse Exon 1.0 ST Array. (F) Graphs showed hybridization intensities for GC genes Bcl6 and Aicda and for PC genes Prdm1, Irf4, and Xbp1 within the sorted populations. Error bars indicate SEM of n = 3–4 samples per group. (G) Heat-map representation of the 8,120 probes differentially expressed in at least one comparison between group IV and groups I, II, or III in the GC array. Probes have been z-score normalized. Similar patterns of gene expression were observed across groups I, II, and III, but not in group IV. (H) Membrane immunoglobulin levels on gated IgE+GFP+, IgG1+GFP+, and IgG+GFP GC and PC cells. Data shown are representative of at least five experiments (B, E, and H), n = 3–5 mice per experiment.
Figure 2.
Figure 2.
Population dynamics of IgE+ and IgG1+ cells during infection with N. brasiliensis. CεGFP BALB/c mice were infected with N. brasiliensis and a group of mice were reinfected 40 d later. (A and B) mLN were collected on days 8, 10, 13, 14, 21, and 30 after primary infection, and on days 7 and 14 after reinfection. (A and B) Kinetics of IgE+GFP+, IgG1+GFP+, and IgG1+GFP GC cells (A) and IgE+GFP+, IgE+GFP, IgG1+GFP+, and IgG1+GFP PCs (B) during primary and secondary N. brasiliensis infection. The frequencies of each cell population are given as proportion of total DAPI viable cells. (C) Frequency of BM IgE+ PC and IgG1+ PC on day 21 of primary infection (pri-inf) and on day 14 of reinfection (re-inf) with N. brasiliensis. UT, untreated mice. n = 3–6 mice per time point from two independent experiments were analyzed (A–C). Error bars indicate SEM.
Figure 3.
Figure 3.
Dysregulated expression of membrane and secreted immunoglobulin in IgE+ cells. (A–D) TBmc mice were immunized with OVA-HA and the mLNs were harvested 12 d later. Cells were incubated with 0–1,000 ng/ml of labeled HA peptide, along with antibodies. (A) Dot plots show the frequencies of IgE+ and IgG1+ cells among the gated IgDIgMB220+CD138 switched GC cells and among CD138+B220lo PC populations. (B) Binding competition between HA peptide and antibodies against membrane immunoglobulin was examined by flow cytometry. Histograms show fluorescence intensity of IgE and IgG1 staining in GC cells costained with increasing concentrations of HA. (C) Histograms show levels of surface-bound HA on IgE+ and IgG1+ GC cells. (D) MFI of bound HA on GC populations (top) and on PC populations (bottom) was determined at different peptide concentrations by subtracting the MFI value of the HA unstained control samples. (E) QPCR primer locations for total IgE, membrane-bound IgE, and secreted IgE transcripts (tr.). (F–H) CεGFP TBmc mice were immunized with OVA-PEP1 and the mLN were harvested 12 d later. (F) QPCR analysis of total VDJ transcript levels in purified IgE+ and IgG1+ GC cells and IgE+ and IgG1+ PC. (G and H) QPCR analysis of secreted and membrane Cε transcripts, and secreted and membrane Cγ1 transcripts in IgE+ and IgG1+ GC cells and in IgE+ and IgG1+ PC. Error bars indicate SEM of n = 3 mice (D and F–H). *, P < 0.05; **, P < 0.01; ***, P < 0.001. Data are representative of two independent experiments (A–D and F–H).
Figure 4.
Figure 4.
BCR signaling is reduced in IgE+ GC cells compared with IgG1+ GC cells upon ex vivo stimulation. (A) Single cell suspensions of mLN from OVA-HA immunized CεGFP TBmc mice were treated with D-PBS or stimulated ex vivo with 10 µg/ml OVA-HA for 5 min. Levels of p-Syk and p-Blnk expression were determined by flow cytometry within gated populations of IgE+GFP+ cells, IgG1+GFP+, and IgG1IgE GC cells, and B220+CD95 non–GC cells (black line histograms). Gray filled histograms correspond to D-PBS–treated controls. Data are representative of two independent experiments (n = 9 mice pooled per experiment). (B) Cells from immunized CεGFP TBmc mice were untreated or stimulated with increasing concentrations of H2O2 for 10 min. Histograms show p-Syk, p-Blnk, and p-Erk1/2 expression levels in gated IgE+GFP+ GC cells (black line) and in IgG1+GFP GC cells (solid gray). Data are representative of nine independent experiments (n = 6–9 mice pooled per experiment). (C) Quantification of p-Syk, p-Blnk and p-Erk1/2 levels (MFI) in H2O2-stimulated IgE+GFP+ and IgG1+GFP GC cells from four independent experiments (n = 6–9 mice pooled per experiment). Error bars represent SEM. *, P < 0.05; **, P < 0.01.
Figure 5.
Figure 5.
Decreased expression of costimulatory molecules on IgE+ GC cells. CεGFP BALB/c mice were infected with N. brasiliensis and mLN cells were harvested and analyzed 10 d later. (A) Flow cytometry analysis of MHC II, CD19, CD40, CD80, LIGHTR, CD21/35, OX40L, and ICOSL surface expression, and assessment of total (surface and intracellular) expression of CD21/35, OX40L, and ICOSL in gated IgE+GFP+ and IgG1+GFP GC cells (FMO = Fluorescence Minus One control). (B) Quantification of surface expression levels (MFI) of CD21/35, OX40L, and ICOSL on gated IgE+GFP+ and IgG1+GFP GC cells. Error bars indicate SEM of n = 5 mice. ***, P < 0.001. Data are representative of three independent experiments (A and B).
Figure 6.
Figure 6.
Altered LZ/DZ distribution and increased apoptosis of IgE+ GC cells compared with IgG1+ GC cells. Single cell suspensions were prepared from the mLN of CεGFP BALB/c mice on day 10 of infection with N. brasiliensis. (A) Dot plots show the DZ and LZ phenotypes among IgE+GFP+, IgG1+GFP+, and IgG1+GFP GC cells. CXCR4 and CD86 were used as markers to discriminate GC LZ (CD86hiCXCR4lo) and DZ (CD86loCXCR4hi) cells. (B) Quantification of DZ to LZ cell ratio among the gated populations. Error bars indicate SEM of n = 6 mice. (C) GSEA analysis showing the enrichment of gene signatures for DZ genes in IgE+ cells and for LZ genes in IgG1+ cells. Gene sets were derived from the DEG of the LZ/DZ array. All nominal P-values and FDR rates were <0.001. (D) Kinetics of BrdU incorporation in total (top) and DZ (bottom) IgE+GFP+ and IgG1+GFP GC cells as assessed by flow cytometry. Error bars indicate SEM of n = 3 mice. (E) Ratio of LZ/DZ BCR expression levels (MFI) on gated LZ (CD86hiCXCR4lo) and DZ (CD86loCXCR4hi) IgE+GFP+ GC cells and IgG1+GC (GFP+ and GFP) cells. Error bars indicate SEM of n = 6 mice. (F) Immunohistology of frozen mLN sections from day 11 after infection with N. brasiliensis to show the distribution of IgE+ and IgG1+ cells (green) in the LZ (CD35+, red) and DZ of the GC. Bar, 50 µm. (G–J) Apoptosis assay performed using the CaspGLOW active Caspase Staining kit. (G) Flow cytometry analysis showing the frequency of apoptotic cells (CaspGLOW+) among the gated populations. (H) Quantification of cell apoptosis (CaspGLOW+). Error bars indicate SEM of n = 5 mice. (I) Apoptotic cell distribution in the CXCR4hi and CXCR4lo compartments of the gated populations. (J) Percentage of apoptotic DZ cells among total apoptotic cells (DZ plus LZ) in IgE+GFP+ and IgG1+GFP GC cells. Error bars indicate SEM of n = 5 mice. Data are representative of at least five independent experiments (A, B, and E), two independent experiments (D and F), and three independent experiments (G–J). *, P < 0.05; **, P < 0.01; ***, P < 0.001. (K and L) DZ to LZ ratio in silico. (K) DZ to LZ ratio when selection of IgE GC cells in the LZ was reduced to 30%. (L) DZ to LZ ratio when IgE DZ cells failed to up-regulate CXCR5 and migrate to the LZ. (M) Frequency of total apoptotic IgE+ and IgG1+ GC cells (left), apoptosis in the DZ (middle), and apoptosis in the LZ (right) resulting from impaired DZ to LZ output in silico. Data represent mean and SD of 30 simulations (K–M).
Figure 7.
Figure 7.
Direct switching origin of IgE+ GC cells: molecular and in silico analysis. (A) Schematic representation of Sγ1 footprint analysis. The switched Sμ-Sε DNA fragments were PCR amplified from purified cells that contained rearrangements to Sε (IgE+ and IgG1+GFP+) and the PCR products were subsequently cloned. Clones containing Sμ-Sε switch regions were identified by QPCR analysis of μ-enhancer and Sε sequences. The presence of Sγ1 sequences was determined by QPCR or DNA sequencing. (B) Sγ1 DNA repeat “footprints” in the Sμ-Sε fragment of IgE+ cells. Sγ1+ clones among Sμ-Sε DNA clones in IgE+ cells sorted from mice after primary and secondary infection/immunization. Mice were subjected to secondary infection at 30–32 d after primary infection or secondary immunization at day 35 after primary immunization. IgE+ GC cells were sorted from pooled mLN and spleen, and IgE+ PCs were sorted from pooled mLN and spleen or BM. n = 3–7 mice per group total pooled from two to three independent experiments. (C) Direct switching model in silico. The graph shows the population kinetics of IgE+ GC cells when they were originated from IgM+ but not IgG1+ GC precursor cells. (D) Sequential switching model in silico. The graph shows the population kinetics of IgE+ GC cells if they were originated from IgG1+ but not IgM+ GC precursor cells. Data represent mean and SD of 30 simulations (C and D).
Figure 8.
Figure 8.
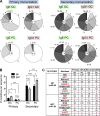
IgE+ GC cells are capable of acquiring affinity enhancing maturations. (A) Analysis of VDJ nucleotide mutations in sorted IgE+ and IgG1+ cells from TBmc mice after primary (day 12) and secondary (day 7) immunization with OVA-PEP1. Mice were subjected to secondary immunization 33 d after primary immunization. The pie charts show the proportion of sequences carrying the indicated number of nucleotide mutations/sequence (n = 45–59 sequences per group). The mean number of mutations is shown in the center of each pie chart. (B) Analysis of VDJ amino acid mutations in sorted IgE+ and IgG1+ cells from TBmc mice after primary (day 12) and secondary (day 7) immunization with OVA-PEP1. The bar graph shows the mean number of amino acid mutations per sequence. Error bars represent SEM of n = 45–59 sequences per group. *, P < 0.05; ***, P < 0.001. (C) The table shows the frequency of CDR3 high affinity mutations (in red).
Figure 9.
Figure 9.
IgE recall responses depend primarily on de novo sequential switching rather than on memory IgE+ B cells. (A) Schematic of transfer experiments in B and C. TBmc mice were immunized with OVA-HA in alum and switched B cells were isolated from pooled spleen and mLN on day 21 after immunization. 2 × 10⁶ switched B cells (B220+CD138IgMIgD) or IgE-depleted switched B cells were injected i.v. into irradiated BALB/c mice together with 1 × 10⁵ naive OVA-specific CD4+ T cells. Recipient mice and the control mice that received CD4+ T cells only (or no donor cells at all) were immunized with OVA-HA in alum. (B) Antigen-specific serum IgE and IgG1 antibody levels in recipient mice as assessed by ELISA 2 wk after transfer. Error bars indicate SEM. (C) QPCR measurement of mature Cε and Cγ1 transcripts in mLN, spleen, and BM of recipient mice 2 wk after cell transfer. Each symbol represents an individual mouse; horizontal lines indicate the mean. n = 4–7 mice per group from three independent experiments (B and C).
Figure 10.
Figure 10.
Evidences of BM-homing IgE+ PCs. (A) Schematic of transfer experiments in B–D. TBmc mice were immunized with OVA-HA in alum and 105 IgE+ PC (B220loCD138+) or IgE switched PC (IgMB220loCD138+) were sorted from pooled spleen and mLN on day 21 after immunization and injected i.v. into irradiated recipient BALB/c mice. (B) HA-specific IgE and IgG1 serum antibody levels in recipient mice 2 wk after cell transfer as determined by ELISA. Error bars indicate SEM. (C) QPCR measurement of mature Cε and Cγ1 transcripts in mLN, spleen, and BM from recipient mice at 2 wk after transfer. Each symbol represents an individual mouse; horizontal lines indicate the mean value. (D) Serum HA-specific IgE levels at 60 d after transfer as determined by ELISA. Serum samples were subjected to twofold predilution. Error bars indicate SEM. Data are representative of two independent experiments (n = 4–5 mice per group per experiment; B–D). **, P < 0.01; ***, P < 0.001.

References

    1. Achatz-Straussberger G., Zaborsky N., Königsberger S., Luger E.O., Lamers M., Crameri R., Achatz G. 2008. Migration of antibody secreting cells towards CXCL12 depends on the isotype that forms the BCR. Eur. J. Immunol. 38:3167–3177 10.1002/eji.200838456 - DOI - PMC - PubMed
    1. Allen C.D., Ansel K.M., Low C., Lesley R., Tamamura H., Fujii N., Cyster J.G. 2004. Germinal center dark and light zone organization is mediated by CXCR4 and CXCR5. Nat. Immunol. 5:943–952 10.1038/ni1100 - DOI - PubMed
    1. Baskin B., Islam K.B., Evengård B., Emtestam L., Smith C.I. 1997. Direct and sequential switching from mu to epsilon in patients with Schistosoma mansoni infection and atopic dermatitis. Eur. J. Immunol. 27:130–135 10.1002/eji.1830270120 - DOI - PubMed
    1. Camberis M., Le Gros G., Urban J., Jr 2003. Animal model of Nippostrongylus brasiliensis and Heligmosomoides polygyrus. Curr. Protoc. Immunol. Chapter 19:12. - PubMed
    1. Curotto de Lafaille M.A., Lafaille J.J. 2010. The biology of IgE: The generation of High Affinity IgE Antibodies. Cancer and IgE: Introducing the Concept of AllergoOncology. Penichet M.L., Jensen-Jarolim E., Springer; 37–46

Publication types

MeSH terms