. 2013 Nov 18;210(12):2641-59.
doi: 10.1084/jem.20131141. Epub 2013 Nov 11.

Deletion of Asxl1 results in myelodysplasia and severe developmental defects in vivo

Affiliations

Deletion of Asxl1 results in myelodysplasia and severe developmental defects in vivo

Omar Abdel-Wahab et al. J Exp Med. .

Abstract

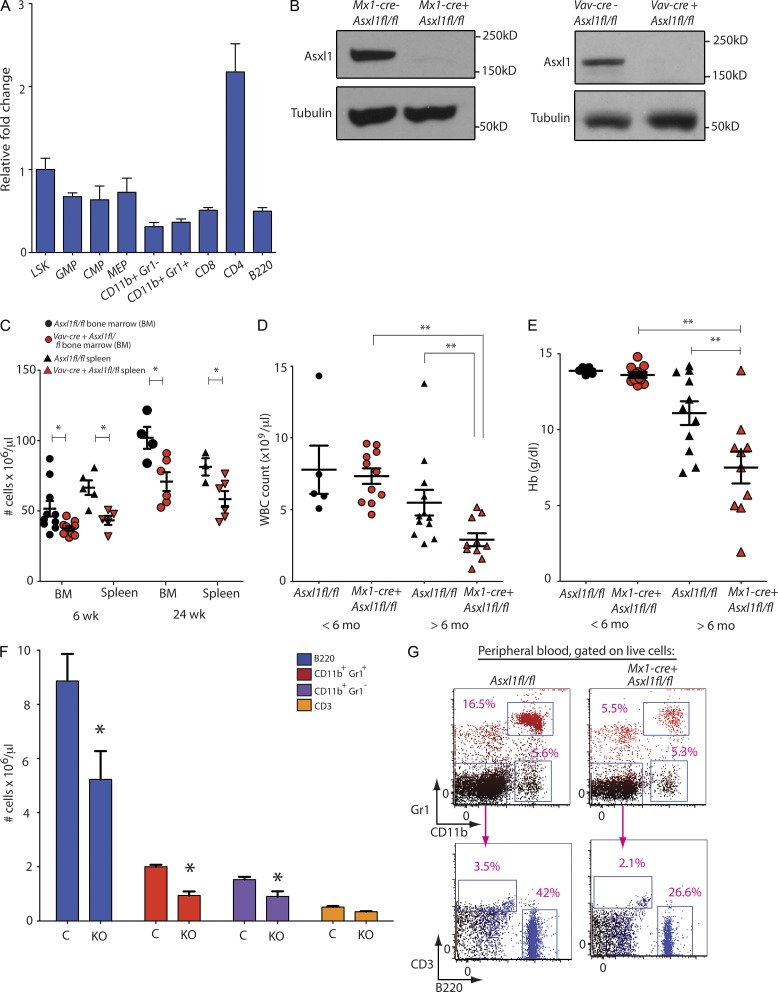
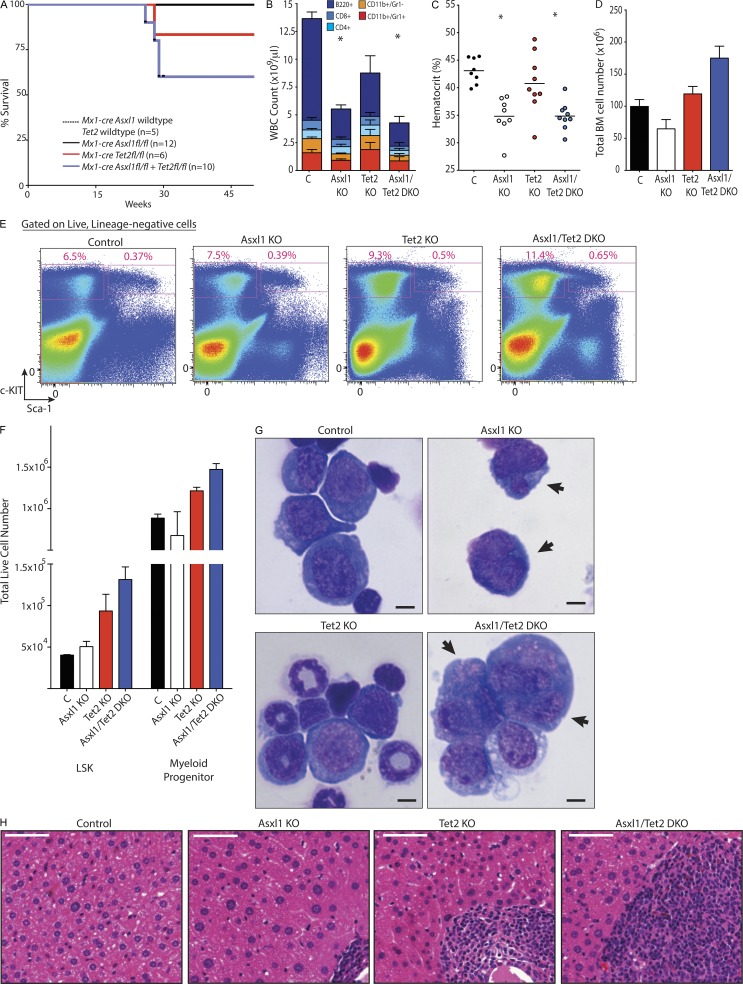
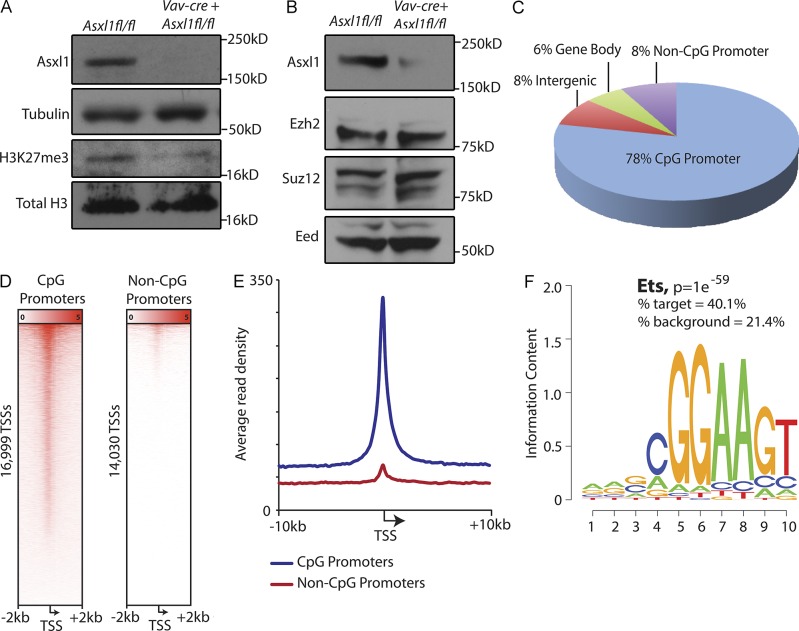
Somatic Addition of Sex Combs Like 1 (ASXL1) mutations occur in 10-30% of patients with myeloid malignancies, most commonly in myelodysplastic syndromes (MDSs), and are associated with adverse outcome. Germline ASXL1 mutations occur in patients with Bohring-Opitz syndrome. Here, we show that constitutive loss of Asxl1 results in developmental abnormalities, including anophthalmia, microcephaly, cleft palates, and mandibular malformations. In contrast, hematopoietic-specific deletion of Asxl1 results in progressive, multilineage cytopenias and dysplasia in the context of increased numbers of hematopoietic stem/progenitor cells, characteristic features of human MDS. Serial transplantation of Asxl1-null hematopoietic cells results in a lethal myeloid disorder at a shorter latency than primary Asxl1 knockout (KO) mice. Asxl1 deletion reduces hematopoietic stem cell self-renewal, which is restored by concomitant deletion of Tet2, a gene commonly co-mutated with ASXL1 in MDS patients. Moreover, compound Asxl1/Tet2 deletion results in an MDS phenotype with hastened death compared with single-gene KO mice. Asxl1 loss results in a global reduction of H3K27 trimethylation and dysregulated expression of known regulators of hematopoiesis. RNA-Seq/ChIP-Seq analyses of Asxl1 in hematopoietic cells identify a subset of differentially expressed genes as direct targets of Asxl1. These findings underscore the importance of Asxl1 in Polycomb group function, development, and hematopoiesis.


Figures

Figure 1.
Figure 1.
Generation of a conditional Asxl1 allele and characterization of mice with constitutive Asxl1 loss. (A) Schematic depiction of the targeted Asxl1 allele. Exons 5–10 are targeted and flanked by LoxP sites upon Frt-mediated deletion of the Neo cassette. (B) Verification of correct homologous recombination of Asxl1-targeted allele using Southern blots on targeted ES cells. (C) Enumeration of offspring derived from mating EIIa-cre Asxl1+/Δ parents. (D and E) Gross pathology (D) and tissue sections (E) of Asxl1Δ/Δ mice at 14.5 and 18.5 d postcoitus (dpc). (F) Analysis of skeletal preparations from germline Asxl1-null mice surviving to E20.5 including hypoplastic mandibles (asterisk), lack of hyoid bone (arrowhead), and lower lumbar/sacral posterior homeotic transformations (arrow). (G) Gross phenotype of EIIa-cre Asxl1+/Δ and littermate control mice on bilateral microphthalmia. Bars: (D) 2 mm; (E and F [top]) 1 mm; (F, bottom) 2.5 mm; (G) 0.5 cm. (H) Immunophenotyping of fetal liver at 14.5 dpc on relative frequency of LSK cells, MPP cells (LSK, CD48+, CD150 cells), and LT-HSCs (LSK, CD48, CD150+ cells) between mice with germline loss of 0, 1, or 2 copies of Asxl1. FACS analysis was performed with three to five independent fetal liver samples per genotype. (I) FACS analysis of fetal liver at 14.5 dpc reveals relative frequency of CD71+ single-positive, CD71/Ter119 double-positive, or Ter119 single-positive cells with constitutive loss of Asxl1. Antibody stainings are as indicated, and cells were gated on live cells in the parent gate. Error bars represent ±SD.
Figure 2.
Figure 2.
Conditional deletion of Asxl1 results in age-dependent leukopenia and anemia. (A) qRT-PCR showing relative expression level of Asxl1 in purified progenitor and mature mouse hematopoietic stem and progenitor subsets. (B) Verification of Mx1-cre– and Vav-cre–mediated deletion of Asxl1 at the level of protein expression in Western blot of splenocytes. (C) Enumeration of nucleated cells in bilateral femurs and tibiae or whole spleens of control (Asxl1fl/fl) and Asxl1 hematopoietic-specific KO mice (Vav-cre Asxl1fl/fl) at 6 as well as 24 wk of age (n = 6–10 mice per genotype at each time point examined). (D and E) Enumeration of peripheral WBCs (D) and Hb (E) with postnatal deletion of Asxl1 (performed using Mx1-cre Asxl1fl/fl mice or Cre Asxl1fl/fl controls). Counts in aged Asxl1 KO mice are compared with age-matched controls as well as younger KO and control mice (n = 6–12 mice per genotype at each time point examined). (F and G) Flow cytometric enumeration of B220+, CD11b+/Gr1+, CD3+, and CD11b+/Gr1 cells in the peripheral blood of >6-mo-old Mx1-cre Asxl1fl/fl (KO) and Asxl1fl/fl (C) mice (n = 5 mice per genotype were used for FACS analysis of peripheral blood). The right panel reveals peripheral blood FACS analysis. Antibody stainings are as indicated, and cells were gated on live cells in the parent gate. (A and C–F) Error bars represent ±SD (A and F); mean ± SEM is shown (C–E); *, P < 0.05; **, P < 0.001 (Mann–Whitney U test).
Figure 3.
Figure 3.
Deletion of Asxl1 results in myeloid and erythroid dysplasia and impaired progenitor differentiation consistent with myelodysplasia. (A) Relative frequency of CD71+/Ter119 erythroid precursors in BM and spleen of 6.5-mo-old Mx1-cre Asxl1fl/fl (KO) and Cre Asxl1fl/fl control mice (expressed as percentage of live cells; n = 3–5 mice per genotype in each tissue type examined by FACS analysis). (B) Histological (H&E) analysis of Mx1-cre Asxl1fl/fl and Cre Asxl1fl/fl control BM from 6-mo-old littermate mice. (C) BM cytospins (Wright-Giemsa) from the same mice (arrows indicate erythroid precursors with prominent irregular nuclear contours). (D) Representative morphology of peripheral blood myeloid cells (top) and nucleated RBCs (bottom) in KO mice (Wright-Giemsa stain). (E) Number of colonies formed 7 d after plating of 1,000 CMP, GMP, or MEP cells into methylcellulose from 6-wk-old Vav-cre Asxl1fl/fl and littermate control (Cre Asxl11fl/fl control) mice. The experiment was performed in biological duplicate. (F) Photograph of methylcellulose colony plate 7 d after plating of MEP cells from 6-wk-old KO and control mice. (G) Histological analysis by H&E staining of liver from 72-wk-old Mx1-cre Asxl1fl/fl mice and littermates. (H) Number of colonies formed 7 d after plating of 200,000 nucleated cells harvested from the liver of 72-wk-old Mx1-cre Asxl1fl/fl or littermate control mice in methylcellulose containing rmIL-3, rm-SCF, rh-IL6, rh-EPO (liver cells from n = 5 mice per genotype plated in methylcellulose). (I) Photomicrograph of colonies grown from cells taken from the liver and plated in methylcellulose is shown on right. Bars: (B) 50 µm; (C) 10 µm; (D) 5 µm; (G) 100 µm; (I) 200 µm. Error bars represent ±SD; *, P < 0.05 (Mann–Whitney U test).
Figure 4.
Figure 4.
Serial noncompetitive transplantation of Asxl1-null cells results in lethal myelodysplastic disorder. (A) Kaplan-Meier survival curve of recipient mice transplanted with 70-wk-old Vav-cre Asxl1fl/fl or Cre Asxl1fl/fl littermate control whole BM after secondary and tertiary transplantation. Also shown is the survival of mice transplanted with purified LSK cells in tertiary transplantation (tertiary transplant of Asxl1fl/fl control LSK cells is not shown; no recipient mice from this group died by 40 wk [n = 5]). Cre Asxl1fl/fl littermate controls were similarly transplanted in parallel in each experiment. Four to six recipient mice were transplanted in each experiment. (B) Hematocrit over time of secondary recipient mice transplanted with Asxl1-null or littermate control whole BM in a noncompetitive manner. The dashed line represents the lower limit of normal hematocrit for C57BL/6 mice (n = 4–6 mice per genotype at each time point). (C) Body weight of secondarily transplanted mice at 50 wk after transplantation (n = 4 mice per genotype). (D) BM histopathology of secondary recipient mice transplanted with Asxl1-null or littermate control whole BM at 50 wk. (E) Relative frequency of LSK cells, MPP cells (LSK+, CD150, CD48+), and LT-HSCs (LSK+ CD150+ CD48) in BM and spleen at 50 wk after noncompetitive secondary transplantation. Frequencies are expressed as frequency of live cells (n = 4 mice per genotype examined for FACS experiments). (F) Relative frequency of MP (lineage c-Kit+ Sca-1), CMP (lineage, c-Kit+, Sca-1, FcγR, CD34+), GMP (lineage c-Kit+ Sca-1, FcγR+ CD34+), and MEP (lineage c-Kit+ Sca-1 FcγR CD34) cells at 50 wk after noncompetitive secondary transplantation. Frequencies are expressed as a frequency of live cells. (G) Photographs of spleens from secondary recipient mice transplanted with Vav-cre Asxl1fl/fl or Cre Asxl1fl/fl littermate control whole BM 50 wk after lethal irradiation. (H) Weight of the same spleens as shown in G (n = 4 mice per genotype). (I) Histopathology of spleens from secondary recipient mice transplanted with Asxl1-null or WT littermate control whole BM 50 wk after noncompetitive secondary transplantation revealing loss of normal splenic architecture. (J) Photographs of representative femur (top) and tibia (bottom) from secondary recipient mice transplanted with Vav-cre Asxl1fl/fl or Cre Asxl1fl/fl littermate control whole BM 50 wk after noncompetitive secondary transplantation. Bars: (D and I) 50 µm; (J) 2 mm. (K) Relative quantification of CD71+/Ter119 and CD71/Ter119 double-positive cells from BM and spleen of secondary recipient mice transplanted with Vav-cre Asxl1fl/fl or Cre Asxl1fl/fl littermate control whole BM 50 wk after noncompetitive secondary transplantation. Frequencies are expressed as a percentage of live cells (n = 4 mice per genotype examined by FACS analysis). (L) Representative FACS plots of data shown in K from splenocytes. Staining is as shown, and live cells were gated in parent gate. Error bars represent ±SD; *, P < 0.05 (Mann–Whitney U test).
Figure 5.
Figure 5.
Asxl1−/− mice have increased stem/progenitor cells but impaired self-renewal. (A) Flow cytometric enumeration of BM LSK cells, LT-HSCs (LSK CD150+ CD48), and MPP cells (LSK CD150 CD48+) in WT (Asxl1fl/fl) and KO (Vav-cre Asxl1fl/fl) mice at 6 wk of age (n = 4–6 mice per genotype as indicated). Data are expressed as total number of live cells per femur. (B) Representative FACS analysis of BM stem cell populations of Asxl1−/− (Vav-cre Asxl1fl/fl) and WT (Asxl1fl/fl) at 6 wk. Antibody stains are as indicated and parent gate is live, lineage cells. (C) Schematic depiction of the competitive transplantation assay. Asxl1fl/fl and Vav-cre Asxl1fl/fl are positive for CD45.2, whereas WT competitor cells are positive for CD45.1. Recipient mice are also CD45.1. Representative FACS plots of the percentage of CD45.1 versus CD45.2 total chimerism in the peripheral blood of recipient animals at 16 wk after competitive transplantation is shown. (D) Percentage of CD45.1 versus CD45.2 total chimerism in the peripheral blood of recipient animals at 4 and 16 wk in primary competitive transplant and serial secondary competitive transplants are shown (n = 5 recipient mice for each genotype; C, control; KO, Asxl1 KO). The experiment was performed in biological duplicate. Error bars represent ±SD; *, P < 0.05 (Mann–Whitney U test).
Figure 6.
Figure 6.
Combined loss of Asxl1 and Tet2 rescues the impaired self-renewal of Asxl1-deficient HSCs. (A) Enumeration of colonies and serial replating capacity of 20,000 whole BM cells from 6-wk-old littermate mice with hematopoietic-specific deletion of Asxl1 (Vav-cre Asxl1fl/fl), Tet2 (Vav-cre Tet2fl/fl), or both (Vav-cre Asxl1fl/fl Tet2fl/fl). (B) Schematic depiction of the competitive transplantation experiment. Control, Vav-cre Asxl1fl/fl, Vav-cre Tet2fl/fl, and Vav-cre Asxl1fl/flTet2fl/fl cells are positive for CD45.2, whereas WT competitor cells are positive for CD45.1. On the right, monthly assessment of donor chimerism in the peripheral blood of recipient animals is shown up to 16 wk after transplant (n = 5 recipient mice were used for each genotype and experiment was performed in biological duplicate). 16-wk chimerism was significantly higher in Tet2−/− transplanted mice compared with all other genotypes. (C) Representative FACS analysis of peripheral blood of mice transplanted with each genotype at 16 wk. Staining schemes are as indicated and parental gate was live cells. (D) Proportion of CD45.2+ peripheral blood cells of each lineage at 16 wk in mice transplanted with each genotype (n = 5 mice analyzed for each genotype) as determined by FACS analysis. Each competitive transplantation experiment was performed in biological duplicate with five recipient mice per genotype in each experiment. Error bars represent ±SD; *, P < 0.05 (Mann–Whitney U test).
Figure 7.
Figure 7.
Concomitant deletion of Asxl1 and Tet2 results in myelodysplasia in mice. (A) Kaplan-Meier survival curve of primary Cre Asxl1fl/fl (n = 5), Mx1-cre Asxl1fl/fl (n = 12), Mx1-cre Tet2fl/fl (n = 6), Mx1-cre Asxl1fl/fl Tet2fl/fl (n = 10 mice per genotype). Mice were treated with polyI:polyC at 4 wk after birth and then followed for 50 wk. (B) Peripheral WBC count and differential of recipient mice transplanted with BM from 6-wk-old Mx1-cre Asxl1 WT Tet2 WT (control; C), Mx1-cre Asxl1fl/fl (Asxl1 KO), Mx1-cre Tet2fl/fl (Tet2 KO), and Mx1-cre Asxl1fl/fl Tet2fl/fl (Asxl1/Tet2 DKO) mice 66 wk after transplantation (68 wk after polyI:polyC administration to recipient mice; n = 10 mice per genotype). Differential was determined by flow cytometric analysis of peripheral blood. (C and D) Hematocrit (C) and total number (D) of nucleated BM cells of same mice as shown in B. Horizontal lines indicate the mean. (E) Representative flow cytometric assessment of relative frequencies of MP and LSK cells in 72-wk-old mice. Parent population was live, lineage cells. (F) Total numbers of LSK and MP cells (lineage Sca-1 c-Kit+) in mice from each genotype at 72 wk of age. This was determined by flow cytometric quantification of living LSK and MP cells from c-KIT–enriched BM cells harvested from spine plus bilateral femurs, tibiae, and humeri of each mouse from each genotype at 72 wk of age (n = 3 mice per group). (G) Wright-Giemsa stain of BM representative erythroid precursor from cytospins of 72-wk-old control, Asxl1 KO, Tet2 KO, or Asx1/Tet2 DKO mice. Arrows indicate multinuclearity and nuclear fragmentation in erythroid precursors. (H) Representation histological sections of liver from 72-wk-old control, Asxl1 KO, Tet2 KO, or Asx1/Tet2 DKO mice Bars: (G) 5 µm; (H) 50 µm. For A and B, n = 10 mice per group; for C–H, n = 3 mice per group. Error bars represent ±SD; *, P < 0.05 (Mann–Whitney U test).
Figure 8.
Figure 8.
Identification of genes significantly dysregulated with deletion of Asxl1 alone and in concert with deletion of Tet2 and their functional impact. (A) Volcano plot of differentially expressed transcripts from RNA-Seq data of 1-yr-old control versus littermate Asxl1 KO (Mx1-cre Asxl1fl/fl) LSK and MP (lineage Sca-1 c-Kit+) cells (experiment included cells from two individual mice per genotype). (B) Venn diagrams of genes significantly up- and down-regulated with Asxl1 loss in LSK and MP (lineage, Sca-1, cKit+) cells from 1-yr-old Mx1-cre Asxl1fl/fl mice and littermate Cre controls as identified in A. (C) qRT-PCR analysis of HoxA and Hox-associated transcription factor genes in LSK cells of 1-yr-old Cre Asxl1fl/fl control versus littermate Vav-cre Asxl1fl/fl. (D) qRT-PCR analysis of p16INK4a in LT-HSCs (lineage, Sca-1+, c-Kit+, CD150+, CD48) and MPP cells (lineage, Sca-1+, c-Kit+, CD150, CD48+) from 6-wk- and 6-mo-old control (C) versus littermate Vav-cre Asxl1fl/fl (KO) mice. (E) Cell cycle analysis of MPPs from 72-wk-old Vav-cre Asxl1fl/fl or littermate Cre Asxl1fl/fl control mice with in vivo BrdU administration. Representative FACS plot analysis showing gating on MPP cells followed by BrdU versus DAPI stain is shown on the left (parent gate is LSK cells). Relative quantification of the percentage of MPP cells in S, G2/M, and G0/1 phase is shown on the right (n = 5 mice per group). (F) Assessment of the proportion of HSPCs undergoing apoptosis was performed by Annexin V/DAPI stain of LSK cells from 72-wk-old Vav-cre Asxl1fl/fl mice or Cre Asxl1fl/fl littermate controls. Representative FACS plot analysis showing gating on LSK cells followed by Annexin V versus DAPI stain is shown on the left (parent gate is lineage cells). Relative quantification of the percentage of Annexin V+/DAPI and Annexin V+/DAPI+ LSK cells is shown on the right (n = 5 mice per group). (G) Comparison of significant differentially expressed genes in LSK cells from 6-wk-old Mx1-cre Asxl1fl/fl, Mx1-cre Tet2fl/fl, or Mx1-cre Asxl1fl/fl Tet2fl/fl relative to controls (or Mx1-cre Asxl1 WT Tet2 WT). 99 genes are uniquely down-regulated in Asxl1/Tet2 DKO mice relative to all other genotypes (left), whereas 49 genes are significantly up-regulated (right). (H) GSEA of overlapping and statistically significant gene sets enriched in the LSK cells of mice with deletion of Asxl1 alone or with combined Asxl1 and Tet2 deletion. (I) Gene sets uniquely enriched in mice with concomitant deletion of Asxl1 and Tet2 relative to all other genotypes as determined by GSEA. Error bars represent ±SD; *, P < 0.05 (Mann–Whitney U test).
Figure 9.
Figure 9.
Effect of Asxl1 loss in vivo on H3K27me3 and identification of Asxl1-regulated genes ChIP-Seq. (A) Western blot analysis of H3K27me3 and total histone H3 in splenocytes of 6-wk-old Vav-cre Asxl1fl/fl mice relative to littermate control. (B) Levels of core PRC2 members Ezh2, Suz12, and Eed in splenocytes of same mice as shown in A. (C) Characterization of Asxl1-binding sites identified by anti-Asxl1 ChIP-Seq analysis in mouse WT BMDMs. (D) Heat map representation of Asxl1 ChIP-Seq signal centered around TSSs (±2 kb) of CpG (left) and non-CpG (right) promoters. (E) Mean Asxl1 ChIP-Seq signal density of CpG and non-CpG promoters centered around the TSS ± 10 kb. (F) Motif enrichment analysis of Asxl1-binding sites identified significant enrichment of Ets transcription factor binding sites (P = 1 ×10−59, percent target = 40.1%, and percent background = 21.4%).

References

    1. Abdel-Wahab O., Adli M., LaFave L.M., Gao J., Hricik T., Shih A.H., Pandey S., Patel J.P., Chung Y.R., Koche R., et al. 2012. ASXL1 mutations promote myeloid transformation through loss of PRC2-mediated gene repression. Cancer Cell. 22:180–193 10.1016/j.ccr.2012.06.032 - DOI - PMC - PubMed
    1. Bejar R., Stevenson K., Abdel-Wahab O., Galili N., Nilsson B., Garcia-Manero G., Kantarjian H., Raza A., Levine R.L., Neuberg D., Ebert B.L. 2011. Clinical effect of point mutations in myelodysplastic syndromes. N. Engl. J. Med. 364:2496–2506 10.1056/NEJMoa1013343 - DOI - PMC - PubMed
    1. Bejar R., Stevenson K.E., Caughey B.A., Abdel-Wahab O., Steensma D.P., Galili N., Raza A., Kantarjian H., Levine R.L., Neuberg D., et al. 2012. Validation of a prognostic model and the impact of mutations in patients with lower-risk myelodysplastic syndromes. J. Clin. Oncol. 30:3376–3382 10.1200/JCO.2011.40.7379 - DOI - PMC - PubMed
    1. Boultwood J., Perry J., Pellagatti A., Fernandez-Mercado M., Fernandez-Santamaria C., Calasanz M.J., Larrayoz M.J., Garcia-Delgado M., Giagounidis A., Malcovati L., et al. 2010. Frequent mutation of the polycomb-associated gene ASXL1 in the myelodysplastic syndromes and in acute myeloid leukemia. Leukemia. 24:1062–1065 10.1038/leu.2010.20 - DOI - PubMed
    1. Bracken A.P., Kleine-Kohlbrecher D., Dietrich N., Pasini D., Gargiulo G., Beekman C., Theilgaard-Mönch K., Minucci S., Porse B.T., Marine J.C., et al. 2007. The Polycomb group proteins bind throughout the INK4A-ARF locus and are disassociated in senescent cells. Genes Dev. 21:525–530 10.1101/gad.415507 - DOI - PMC - PubMed

Publication types

MeSH terms