. 2014 Feb 1;20(3):711-23.
doi: 10.1158/1078-0432.CCR-13-1256. Epub 2013 Nov 11.

A collagen-remodeling gene signature regulated by TGF-β signaling is associated with metastasis and poor survival in serous ovarian cancer

Affiliations

A collagen-remodeling gene signature regulated by TGF-β signaling is associated with metastasis and poor survival in serous ovarian cancer

Dong-Joo Cheon et al. Clin Cancer Res. .

Abstract

Purpose: To elucidate molecular pathways contributing to metastatic cancer progression and poor clinical outcome in serous ovarian cancer.

Experimental design: Poor survival signatures from three different serous ovarian cancer datasets were compared and a common set of genes was identified. The predictive value of this gene signature was validated in independent datasets. The expression of the signature genes was evaluated in primary, metastatic, and/or recurrent cancers using quantitative PCR and in situ hybridization. Alterations in gene expression by TGF-β1 and functional consequences of loss of COL11A1 were evaluated using pharmacologic and knockdown approaches, respectively.

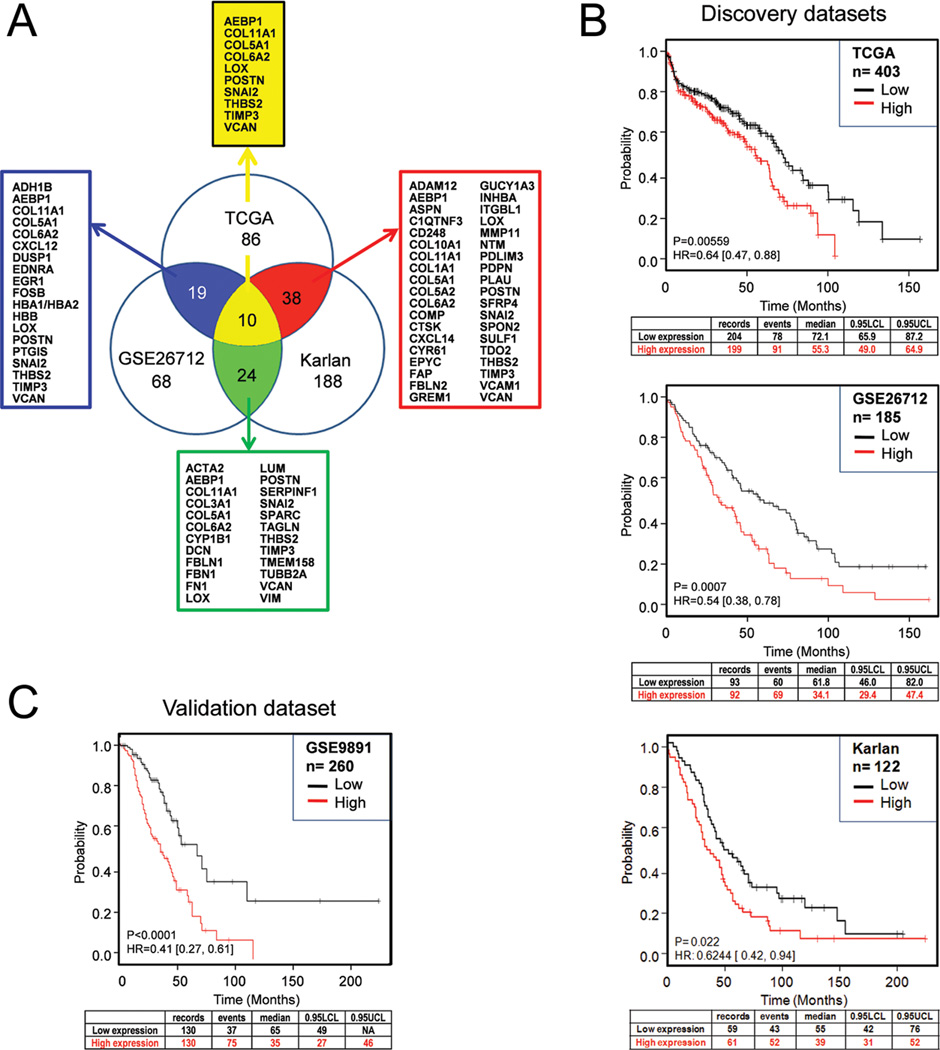
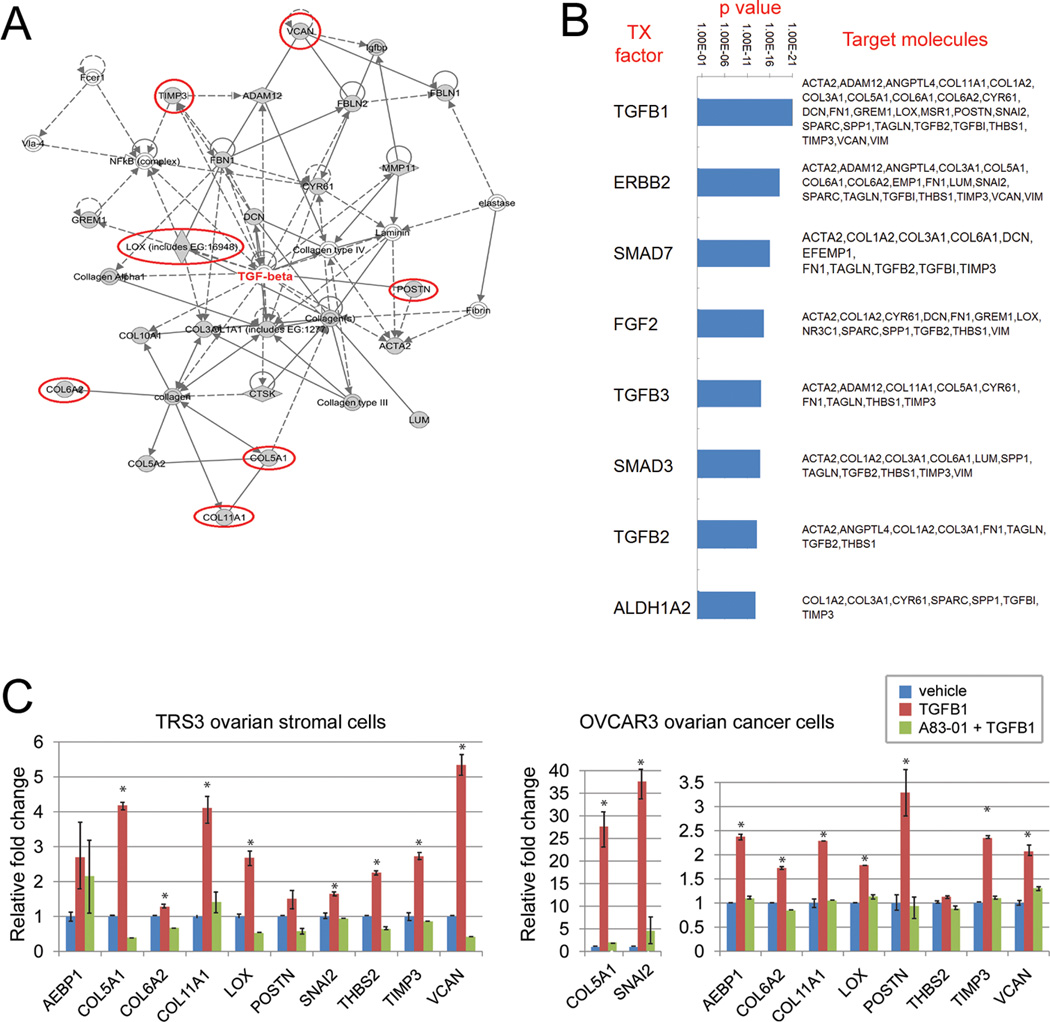
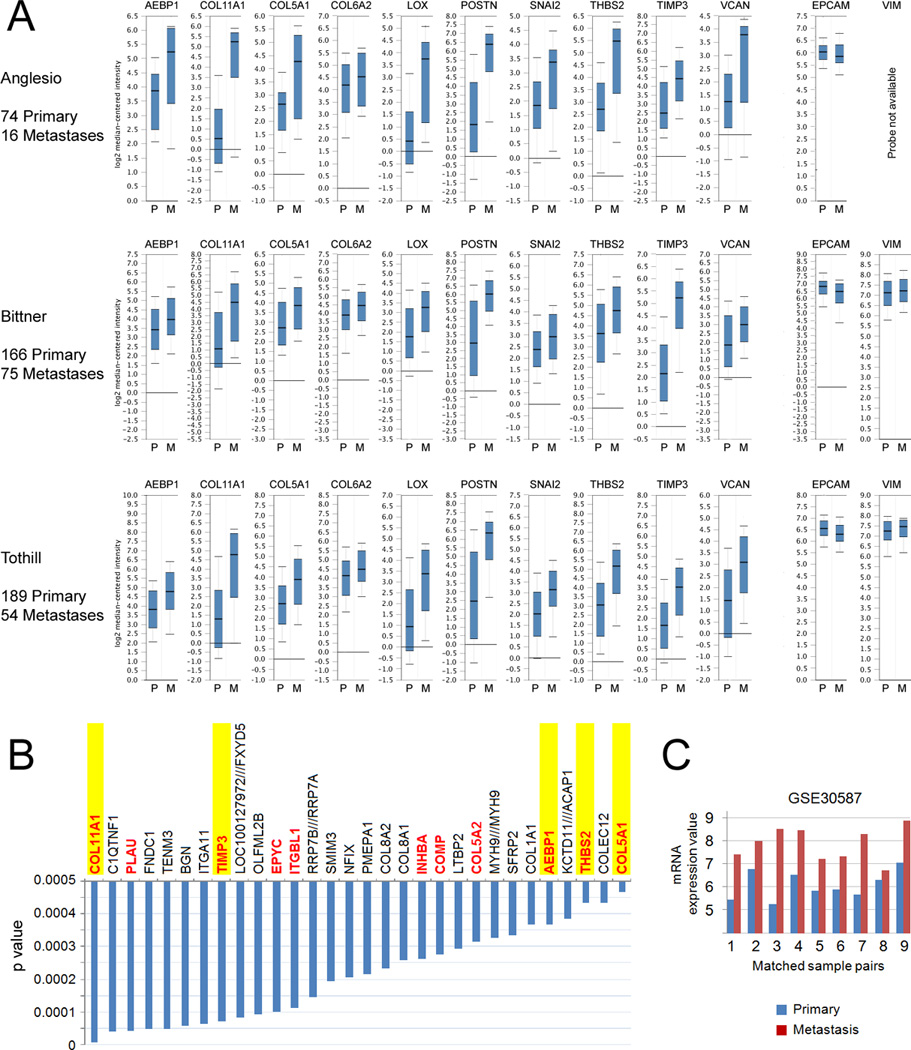
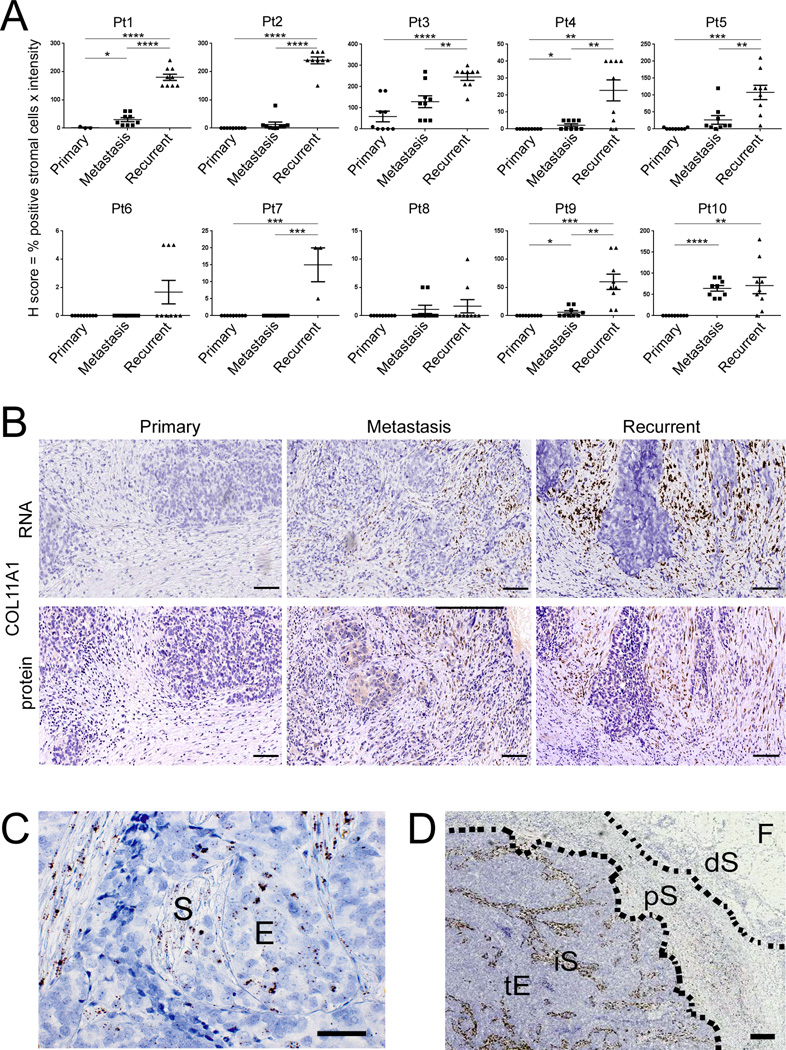
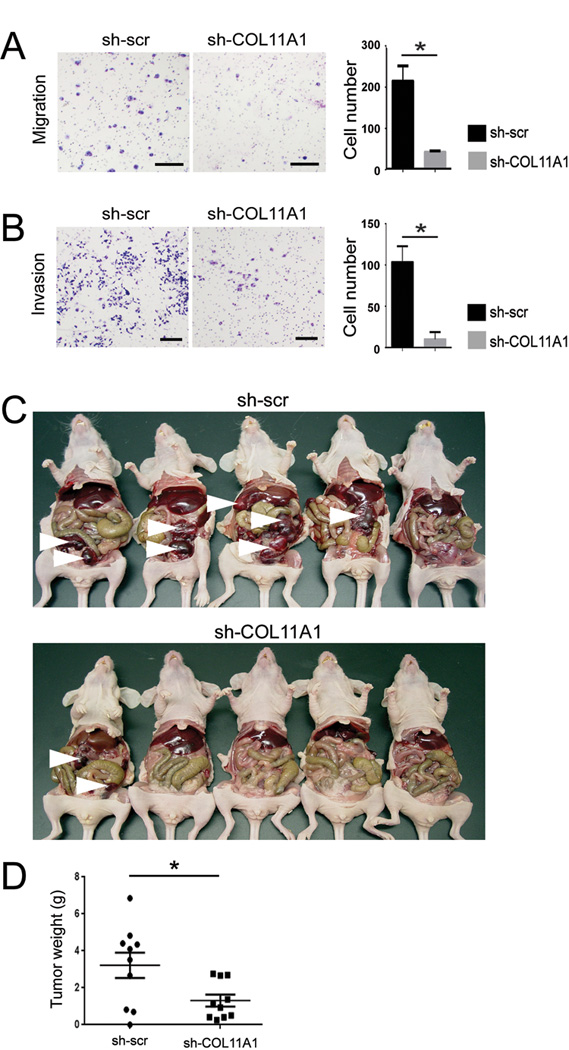
Results: We identified and validated a 10-gene signature (AEBP1, COL11A1, COL5A1, COL6A2, LOX, POSTN, SNAI2, THBS2, TIMP3, and VCAN) that is associated with poor overall survival (OS) in patients with high-grade serous ovarian cancer. The signature genes encode extracellular matrix proteins involved in collagen remodeling. Expression of the signature genes is regulated by TGF-β1 signaling and is enriched in metastases in comparison with primary ovarian tumors. We demonstrate that levels of COL11A1, one of the signature genes, continuously increase during ovarian cancer disease progression, with the highest expression in recurrent metastases. Knockdown of COL11A1 decreases in vitro cell migration, invasion, and tumor progression in mice.

Conclusion: Our findings suggest that collagen-remodeling genes regulated by TGF-β1 signaling promote metastasis and contribute to poor OS in patients with serous ovarian cancer. Our 10-gene signature has both predictive value and biologic relevance and thus may be useful as a therapeutic target.


Conflict of interest statement

COI: All authors declare no conflict of interest

Figures

Fig. 1
Fig. 1
Identification and validation of the 10-gene signature associated with poor overall survival. (A) Venn diagram of poor outcome gene signatures identified from three microarray datasets (TCGA, GSE26712, and Karlan). The number of overlapping genes is indicated and arrows point to the corresponding lists of overlapping genes. The 10 genes present in all three signatures are listed at the top. (B) Validation of the predictive value of the 10-gene signature from three discovery datasets (TCGA, GSE26712, and Karlan) and (C) one independent validation dataset (Tothill). Kaplan-Meier curves, log-rank P values and hazard ratios (HR) are shown to compare overall survival between two patient groups with ‘high’ (indicated by the red line) and ‘low’ (indicated by the black line) expression of the 10-gene signature. The cutoff for the risk index is the median of the continuous risk factor. 0.95 LCL, the 95% lower confidence limit interval for the median time; UCL, upper confidence limit.
Fig 2
Fig 2
Regulation of the poor outcome signature genes by TGFβ signaling. (A) Ingenuity Pathway Analysis of the 61 genes present in at least two of the three discovery signatures of poor outcome. Genes that are present in all three discovery signatures are circled in red. (B) Top transcription factors regulating the 61 poor survival genes are ranked by p values. Downstream target genes are listed. (C) Induction of the 10 poor outcome signature genes by TGFβ1 in the ovarian stromal cell line TRS3 and the ovarian cancer cell line OVCAR3. Cells were treated with TGFβ1 (10 ng/ml) for 48 hours (TRS3) or 1–3 hours (OVCAR3) with or without pre-treatment with the TGFβ1 receptor inhibitor, A83-01. Shown is the relative fold change of the mRNA levels compared to untreated control cells. Data are presented as the mean +/− SEM in triplicate samples. * indicates P<0.05. Data are representative of at least three independent experiments.
Fig 3
Fig 3
Enrichment of the 10-gene signature in metastatic ovarian cancer. (A) Oncomine mRNA expression analysis of the 10 poor outcome genes in three public ovarian cancer microarray datasets. Expression of the poor outcome genes are shown in primary (P) and metastatic (M) ovarian tumor samples using whisker plots with log2 median-centered intensity. EPCAM and VIM were used as markers of the relative content of epithelial and stromal cells, respectively. (B) List of genes enriched in metastases compared to primary tumors in the GSE30587 microarray dataset, which consists of nine matched pairs of primary and metastatic tumors. Genes that are present in at least two of the three poor prognosis signatures are in red font. Genes that overlap with the 10-gene signature are highlighted in yellow. (C) COL11A1 mRNA expression in nine matched primary and metastatic ovarian tumor samples in the GSE30587 microarray dataset.
Fig 4
Fig 4
Increase in COL11A1 expression during ovarian cancer progression. (A) Quantification of COL11A1 in situ hybridization signal in matched triplets of primary ovarian cancer, concurrent metastasis, and recurrent/persistent metastasis from 10 patients. H score = % positive stromal cells × intensity (0, 1+, 2+, 3+) under 10× objective. Each point represents the H score in a single field. Nine intratumoral fields were scored in each sample except for two samples in which only three fields were scored due to a minimal amount of tumor tissue. Data are presented as the mean +/− SEM. *P<0.05; **P<0.005; ***P<0.0005; ****P<0.0001. (B) Representative COL11A1 in situ hybridization and COL11A1 immunohistochemistry in serial sections of samples from Patient 1. (C) Detection of a positive focal COL11A1 in situ hybridization signal in cells exhibiting stromal (S) and epithelial (E) morphology. (D) Representative image of COL11A1 distribution in intra- and peri-tumoral areas. tE, tumor epithelium; iS, intratumoral stroma; pS, peritumoral stroma; dS, distant stroma; F, fat. Hematoxylin counterstain. Size bar is 100 µm in all panels.
Fig 5
Fig 5
COL11A1 knockdown results in decreased cell migration, invasion, and tumor progression. (A) Migration and (B) invasion assays of A2780 cells with scrambled shRNA (sh-scr) or shRNA specific to COL11A1 (sh-COL11A1). Shown are representative images of migrated cells after 24 hours and invasive cells after 48 hours. Size bar, 25 µm. The bar graph shows the quantification of migrated cells in four different fields at 10× magnification and invasive cells in four different fields at 4× magnification. Data are presented as the mean +/− standard deviation. *P<0.05. (C) Photograph of nude mice with tumors that formed 14 days after intraperitoneal injection of A2780 cells transduced with scrambled shRNA control (sh-scr; 5 mice) or shRNA specific to COL11A1 (sh-COL11A1; 5 mice). White arrowheads indicate large tumor nodules. (D) Quantification of wet tumor weight after resection of tumor nodules from 20 mice in the replication experiment of intraperitoneal injection of A2780 cells transduced with sh-scr (10 mice) or sh-COL11A1 (10 mice). Each dot indicate an individual mouse. Data are presented as the mean +/− SEM, *P=0.02.

References

    1. Bast RC, Jr, Hennessy B, Mills GB. The biology of ovarian cancer: new opportunities for translation. Nat Rev Cancer. 2009;9:415–428. - PMC - PubMed
    1. Jemal A, Siegel R, Xu J, Ward E. Cancer statistics, 2010. CA Cancer J Clin. 2010;60:277–300. - PubMed
    1. Paik S, Shak S, Tang G, Kim C, Baker J, Cronin M, et al. A multigene assay to predict recurrence of tamoxifen-treated, node-negative breast cancer. N Engl J Med. 2004;351:2817–2826. - PubMed
    1. van de Vijver MJ, He YD, van't Veer LJ, Dai H, Hart AA, Voskuil DW, et al. A gene-expression signature as a predictor of survival in breast cancer. N Engl J Med. 2002;347:1999–2009. - PubMed
    1. Cancer Genome Atlas Research N. Integrated genomic analyses of ovarian carcinoma. Nature. 2011;474:609–615. - PMC - PubMed

Publication types

MeSH terms