Phage T7 Gp2 inhibition of Escherichia coli RNA polymerase involves misappropriation of σ70 domain 1.1
- PMID: 24218560
- PMCID: PMC3856789
- DOI: 10.1073/pnas.1314576110
Phage T7 Gp2 inhibition of Escherichia coli RNA polymerase involves misappropriation of σ70 domain 1.1
Abstract
Bacteriophage T7 encodes an essential inhibitor of the Escherichia coli host RNA polymerase (RNAP), the product of gene 2 (Gp2). We determined a series of X-ray crystal structures of E. coli RNAP holoenzyme with or without Gp2. The results define the structure and location of the RNAP σ(70) subunit domain 1.1(σ(1.1)(70)) inside the RNAP active site channel, where it must be displaced by the DNA upon formation of the open promoter complex. The structures and associated data, combined with previous results, allow for a complete delineation of the mechanism for Gp2 inhibition of E. coli RNAP. In the primary inhibition mechanism, Gp2 forms a protein-protein interaction with σ(1.1)(70), preventing the normal egress of σ(1.1)(70) from the RNAP active site channel. Gp2 thus misappropriates a domain of the RNAP holoenzyme, σ(1.1)(70), to inhibit the function of the enzyme.
Keywords: X-ray crystallography; bacteriophage T7 Gp2; transcription.
Conflict of interest statement
The authors declare no conflict of interest.
Figures

 ,
,  ,
,  , and
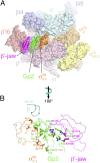
, and  ) and thin regions represent flexible loop regions (16). Hollow white regions denote disordered loops. The structural core of
  and the linker connecting
  with
with  are colored dark orange. The rest of σ70 is colored light orange except the nonconserved region σ70 (σ70NCR) (NCR inserted between conserved sequence regions 1.2 and 2.1) is colored light yellow (17, 29). The expanded view below denotes the secondary structure of
  and the
  linker (the thin line represents loop regions with dashed lines representing disordered segments not modeled; rectangles represent α-helices numbered α1–α3 in the σ701.1 structural core). The modeled portion of
  is colored as a ramp from the N terminus (blue, residue 6) to the C terminus (red, residue 83). (B–D) Structural views of E. coli E-σ70. The RNAP is shown as a molecular surface except
  is shown as a backbone ribbon and color-ramped according to the lower part of A. Disordered connecting segments are denoted by orange spheres. The nomenclature for the β- and β′- lineage–specific inserts (βi4, βi9, and β′i6) is as in ref. . (B) View into the active site channel (channel view) showing
  in the channel. (C) View down through the β-subunit (β-side view), with β removed to reveal the active site (Mg2+ ion, yellow sphere) and nucleic acid binding channels. Superimposed is the DNA from an initiation complex structure (downstream portion of the transcription bubble, and 10-bp of downstream duplex DNA; PDB ID code 4G7H) (38), shown as a gray cartoon (light gray, template strand; dark gray, nontemplate strand).
  occupies the downstream duplex DNA binding channel with its center of gravity at approximately +8. (D)
  is nestled in the RNAP channel, interacting with elements of the β2 domain (β-residues 165–166, 197, and 202–203), the clamp (β′-residues 120, 132–133, and the rudder around residue 311), and other elements of the β′-pincer (β′-residues 1310–1311). The three methionine residues identified within
  from selenomethionyl anomalous peaks (
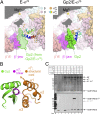
 (orange) are shown as backbone ribbons with transparent molecular surfaces, as is Gp2 (green) sandwiched between them. Gp2 forms significant protein–protein interfaces with both β′-jaw and
  , serving as a bridge between them. (B) View of the
  -jaw protein–protein–protein interaction, viewed from the RNAP active site outwards. The proteins are shown as backbone worms, with selected interacting side chains highlighted (also see
  interface, and the five salt bridges characterizing the relatively polar Gp2–β′-jaw interface. Also shown is a segment of the β2 domain that interacts with Gp2.
 within the RNAP active site channel. (A) Cutaway views of the RNAP active site channel (similar to the view of Fig. 1C). (Left) E-σ70, but with the position of Gp2 (from the Gp2–E-σ70 structure) outlined (green), illustrating the steric clash between
  and Gp2. (Right) Gp2–E-σ70; comparison with E-σ70 reveals the reorientation of the
  structural core and the disordered
  linker. (B) The
  linker from E-σ70 and Gp2–σ70 were superimposed by the
  structural core (orange), revealing that the
  linker helix (magenta) and Gp2 (green) interact with the same hydrophobic surface of the
  structural core between α-helices α1 and α3. (C) Gp2[F27BpA] cross-links to
  . (Upper) Silver-stained SDS/PAGE gel showing the migration positions of β, β′, σ70, ∆1.1σ70, and Gp2[F27BpA] before (lanes 1, 3, 5, and 7) and after (lanes 2, 4, 6, and 8) UV–cross-linking. The reaction components in each lane are indicated at the top of C. (Lower) Western blot of the gel shown (Upper) with anti-Gp2 polyclonal antibodies. The Gp2[F27BpA]-σ70 complex is indicated. The expected position of the absent Gp2–Δ1.1σ70 cross-linking product is also shown.
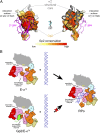
 for E-σ70 inhibition. (A) The interaction surfaces on Gp2 for the β′-jaw and for
  are conserved among Gp2 homologs. Shown are two views of the β′-jaw–Gp2–
 interacting protein triplet. Gp2 is shown as a molecular surface color-coded according to conservation (39) within an alignment of 25 Gp2 homologs (19) as shown on the color scale below. The β′-jaw (magenta) and the
  structural core (gray) are shown as backbone ribbons. The interaction surfaces of the Gp2 binding partners are outlined in black on the Gp2 surface. (B) Schematic illustrating the mechanism for Gp2 inhibition of E-σ70. In E-σ70 (Upper Left),
  occupies the RNAP downstream duplex DNA channel. Formation of RPo with promoter DNA causes the ejection of
  from the channel (Right). In Gp2–E-σ70 (Lower Left), Gp2 (green) forms a protein bridge between β′ and
  , preventing the egress of
  from the channel and thereby blocking the entry of the promoter DNA.
Comment in
-
Structure of Escherichia coli RNA polymerase holoenzyme at last.Proc Natl Acad Sci U S A. 2013 Dec 3;110(49):19662-3. doi: 10.1073/pnas.1320604110. Epub 2013 Nov 22. Proc Natl Acad Sci U S A. 2013. PMID: 24272941 Free PMC article. No abstract available.
References
-
- Molineux IJ. In: The Bacteriophages. Calendar R, editor. New York: Oxford Univ Press; 2005. pp. 277–301.
-
- Hesselbach BA, Nakada D. Inactive complex formation between E. coli RNA polymerase and inhibitor protein purified from T7 phage infected cells. Nature. 1975;258(5533):354–357. - PubMed
-
- Nechaev S, Severinov K. Inhibition of Escherichia coli RNA polymerase by bacteriophage T7 gene 2 protein. J Mol Biol. 1999;289(4):815–826. - PubMed
Publication types
MeSH terms
Substances
Associated data
- Actions
- Actions
- Actions
- Actions
Grants and funding
LinkOut - more resources
Full Text Sources
Other Literature Sources

