. 2013 Nov 26;110(48):E4678-87.
doi: 10.1073/pnas.1310065110. Epub 2013 Nov 11.

Rapid stimulus-evoked astrocyte Ca2+ elevations and hemodynamic responses in mouse somatosensory cortex in vivo

Affiliations

Rapid stimulus-evoked astrocyte Ca2+ elevations and hemodynamic responses in mouse somatosensory cortex in vivo

Barbara Lykke Lind et al. Proc Natl Acad Sci U S A. .

Abstract

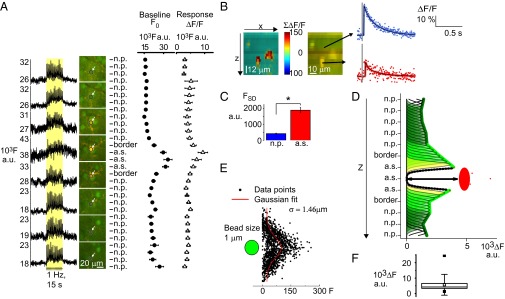
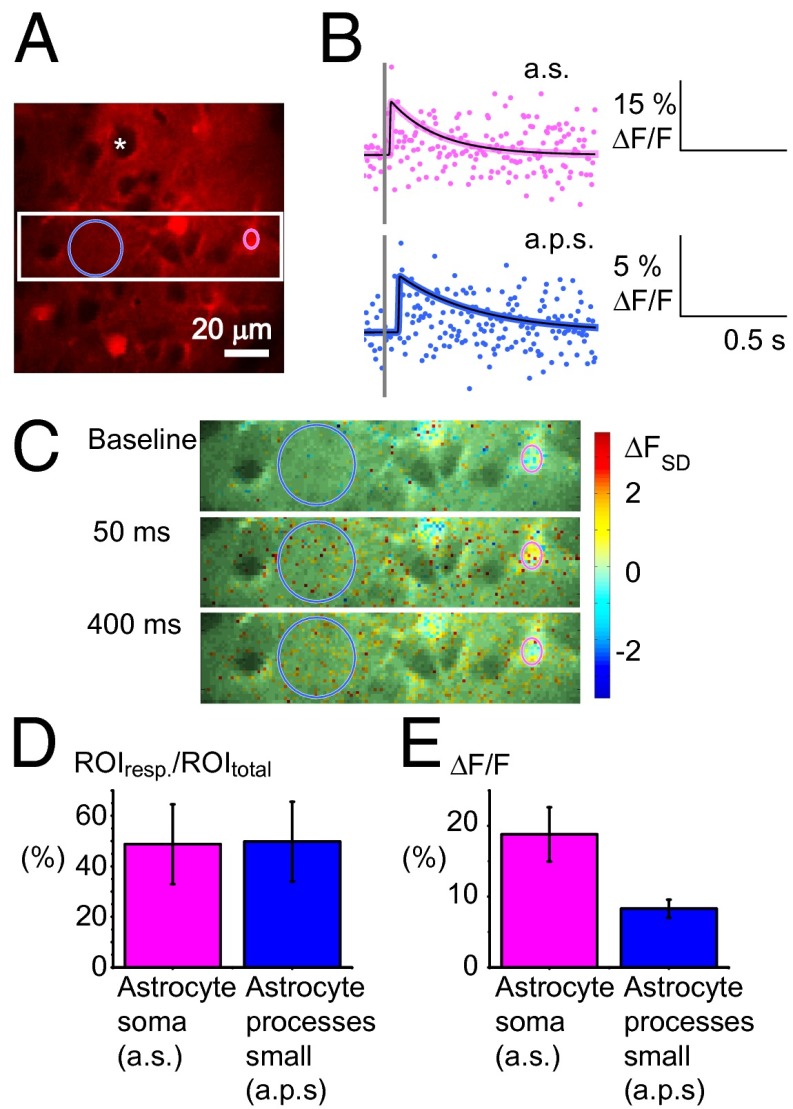
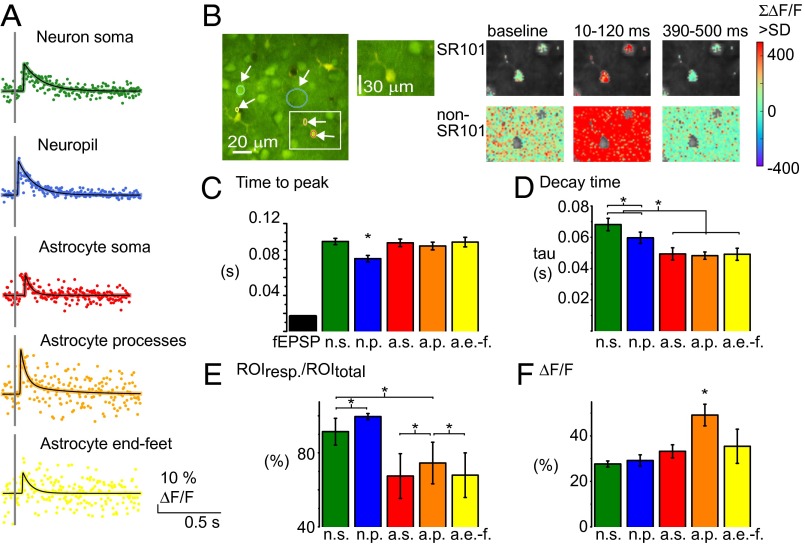
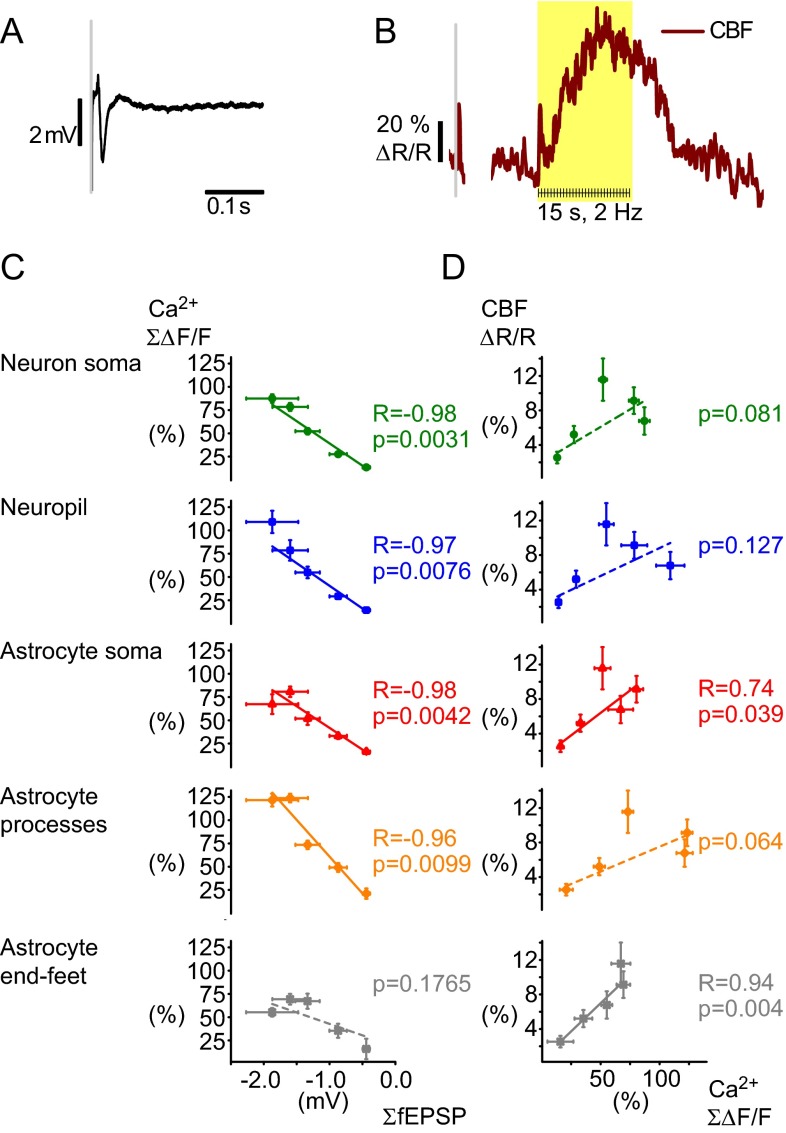
Increased neuron and astrocyte activity triggers increased brain blood flow, but controversy exists over whether stimulation-induced changes in astrocyte activity are rapid and widespread enough to contribute to brain blood flow control. Here, we provide evidence for stimulus-evoked Ca(2+) elevations with rapid onset and short duration in a large proportion of cortical astrocytes in the adult mouse somatosensory cortex. Our improved detection of the fast Ca(2+) signals is due to a signal-enhancing analysis of the Ca(2+) activity. The rapid stimulation-evoked Ca(2+) increases identified in astrocyte somas, processes, and end-feet preceded local vasodilatation. Fast Ca(2+) responses in both neurons and astrocytes correlated with synaptic activity, but only the astrocytic responses correlated with the hemodynamic shifts. These data establish that a large proportion of cortical astrocytes have brief Ca(2+) responses with a rapid onset in vivo, fast enough to initiate hemodynamic responses or influence synaptic activity.

Keywords: Ca2+ imaging; functional imaging; neurovascular coupling; sensory barrel cortex.


Conflict of interest statement

The authors declare no conflict of interest.

Figures

Fig. 1.
Fig. 1.
Ca2+ imaging during somatosensory stimulation reveals that both astrocytes and neurons have fast response patterns. (A) Double labeling allows distinction between astrocytic and neuronal structures. Layers II/III of the whisker barrel cortex were loaded with astrocyte-specific dye SR101 (red) in combination with the Ca2+ fluorophore OGB (green) and vascular TRITC-dextran (red). Regions of interest (ROIs) are marked with colored rings: one neuronal soma (green), two astrocyte somas (red), and one neuropil region (blue). The fluorescence changes are shown in B (white arrows) and in Fig. 2A (red arrow). (Scale bar: 20 µm.) (B) Data traces from one mouse during 15-s, 0.5-Hz stimulation. Each black line indicates stimulations; the yellow area marks the stimulation period. The fluorescence changes are given in percentage of baseline Ca2+ activity (ΔF/F0).
Fig. 2.
Fig. 2.
Stimulation-evoked astrocyte Ca2+ signals can be split into high- and low-frequency components. (A) Representative example of Ca2+ activity recorded in an astrocytic soma; see red arrow in Fig. 1A, in percentage of baseline Ca2+ activity (ΔF/F0). The yellow area marks whisker-pad stimulation at 2 Hz for a period of 15 s. (B) The astrocyte Ca2+ signal (A) separated by wavelet transformation to a high-frequency (Upper) and a low-frequency component (Lower). The red triangle indicates the start of the slow Ca2+ response, as defined by the max slope before the main peak. (C) The high-frequency response interpolated as a single fast Ca2+ signal by superimposing data from the 15-s train of stimulation; see Movie S2. Red dots represent data points collected at different times after repeated stimuli; the black line represents the interpolated signal. The gray line marks the time of the single stimulation. (D) The fast Ca2+ signal fitted so that the decay time of the signal (tau) can be estimated. (E) Latency of astrocyte cell body response times for the evoked fast and induced slow components expressed as a percentage of all astrocytes. The histogram shows great variation in latency time to onset of slow responses but also that a subset of astrocytes responded within the first 5 s of stimulation (154 astrocytes, 33 mice, 2 Hz stimulation frequency).
Fig. 3.
Fig. 3.
Glutamate receptor antagonists reduced the prevalence of both fast and slow astrocytic Ca2+ signals. (A) The AMPA receptor antagonist CNQX and the mGluR5a antagonist MPEP significantly reduced the mean of ROIs responding both with fast and slow Ca2+ signals, but not to the same degree. The percentage of responding ROIs during 15-s, 2-Hz whisker stimulation was studied in n = 10 ROIs from three animals for CNQX and n = 23 ROIs from six animals for MPEP. Error bars represent SEM. (B) Examples of drug effects in percentage of baseline Ca2+ activity (ΔF/F0) in some astrocytes using the calcium indicator OGB and 2-Hz stimulation of the whisker pad. The size of the Ca2+ responses, in astrocytic structures only, is shown in color scale overlaid 2-PM images of the field of view. Images on the Left show the size of the sum of the fast Ca2+ signal 10 to 120 ms after stimulation with or without drugs; images on the Right are of a sum of part of the slow astrocytic Ca2+ signals after 4 s of stimulation. (Scale bar: 10 µm.)
Fig. 4.
Fig. 4.
Identification of fast Ca2+ signals in astrocyte soma, processes, and end-feet in response to single stimuli and before vessel dilatation. (A) Examples of fast Ca2+ signals evoked by 15-s whisker-pad stimulation at 0.5 Hz averaged within ROIs in an OGB/SR101-stained preparation; astrocyte soma (a.s., indicated by red ring), processes (a.p., orange ring), and end-feet (a.e.-f., yellow ring). The arrows point to fitted interpolated signals from each ROI, shown with a black line and colored dots that represent original data points. The gray line marks the time of the stimulation. The fluorescence changes are given in percentage of baseline Ca2+ activity (ΔF/F0). The white square indicates the area shown in B, and the white line marks the line analysis shown in C. (B) Location of Ca2+ signal in astrocytic areas only, during 15-s stimulation at 0.5 Hz. Pixels were defined as astrocytic if the SR101 staining was 2 SD above the level of the entire image. The color scale of the pixels gives the Ca2+ responses measured in SDs of baseline activity (ΔFSD). Responses ≥2 ΔFSD were considered significant. (C) Same vessel as in A shown before and during 15-s stimulation at 3 Hz, with the summed fast Ca2+ response from 10 to 120 ms after stimulation in ΔF/F0. Below are the results from a line analysis of the raw OGB channel and filtered as pixels below or above 85% of the average intensity (u < ū*0.85). The traces at the bottom show the sum of these pixels in % of baseline (dark red) and the first fast Ca2+ response in the adjacent astrocytic end-feet (black).
Fig. 5.
Fig. 5.
ROI-based laminar analysis of Ca2+ activity during stimulation localizes origin of fast signals to active astrocytic cell bodies, uncontaminated by neuropil signals. (A) OGB- and SR101-loaded 2-PM images were taken during stimulation in separate experiments in which the focal plane was changed at 4-µm intervals. The double stain allowed us to record localized activity in the same ROI as the focus changed from the neuropil (n.p.) to astrocyte border, to astrocytic soma (a.s.), to astrocyte border, and back to the neuropil (n = 16 ROIs from three animals). Leftmost shows the raw fluorescent Ca2+ signal at neuropil and astrocyte locations in arbitrary units (a.u.) whereas Center shows the images. In Right are the mean values from different levels from all 16 ROIs included in this study. The baseline fluorescence (●) was higher in astrocytic soma than in the neuropil, and, during stimulation, the Ca2+ response (Δ) was larger in the astrocyte soma than in the neuropil. (B) Fast Ca2+ signals from astrocytes along the z axis. The stack is recorded at different depths of z. The activity is shown in pixels defined as astrocytic by a > 2 SD SR101. The Ca2+ response is shown in percentage of baseline (ΔF/F0), summed from 10 to 120 ms after stimulation. To the Right is the same image in OGB/SR101. The arrow points to interpolated fast Ca2+ signal in ΔF/F0 from an ROI inside and above the astrocyte. (C) The baseline fluorescent level of activity was higher in astrocytes than in neuropil. The baseline Ca2+ activity was estimated as the mean of the SD in the fluorescence signal (FSD). FSD was much higher in astrocyte somas (n = 151) than in neuropil (n = 115) in 32 animals. Error bars in SEM. (D) The influence of neuropil fluorescence on astrocyte Ca2+ signals during evoked activity is negligible. For each focus level of experiment, areas without a clear view of the astrocyte soma were considered to be neuropil. The contribution from each such area to the center of the astrocyte was estimated by Gaussian distribution (green arcs), based on size of the point spread function of the system. The arrow indicates the distance between summed fluorescence contributed from neuropil (black stippled line) due to point spread of fluorescence along the z axis and the level of fluorescence inside the astrocyte soma (red). (E) The width of the point spread function was found to be σ = 1.46 µm as indicated by imaging of 1-µm beads under the same conditions as during the experiments (n = 20 beads). (F) The averaged difference in raw fluorescence levels (n = 28 ROIs), error bars in SD; the black squares show the max and min values and the white square the mean difference in fluorescence.
Fig. 6.
Fig. 6.
Fast Ca2+ transients in response to somatosensory stimulation in astrocytes specifically stained with Rhod2. (A) A 2-PM image from layers II/III of the whisker-barrel cortex surface-loaded with Rhod2. The pink ring encircles an astrocytic soma ROI, and the blue ring depicts an ROI containing small astrocyte processes. The white asterisk indicates the black shadow of an unstained neuronal soma. The white square marks an area enlarged in C. (Scale bar: 20 µm.) (B) Interpolated fast Ca2+ signals during 15-s, 1-Hz whisker-pad stimulation, in astrocytic soma (a.s.) and small astrocytic processes (a.p.s.) in percentage of baseline fluorescence levels (ΔF/F0). The gray line indicates the stimulation time. (C) Time series of images showing fast Ca2+ activity in Rhod2-stained tissue. The pixel color scale shows the Ca2+ responses measured in SDs of baseline activity (ΔFSD). Responses ≥2 ΔFSD were considered significant. (D) Approximately half of the Rhod2-stained ROIs responded with fast Ca2+ signals during stimulation independently of the stimulus frequency. Mean of percentage of responding ROIs (n = 12), error bars in SE of proportions. (E) Mean maximum Ca2+ signals in percentage of baseline activity (ΔF/F0) in ROIs that responded at each stimulation frequency. The fast Ca2+ responses were bigger in astrocyte soma than in small processes (n = 12 mice).
Fig. 7.
Fig. 7.
Fast Ca2+ signals exist both in neurons and astrocytes but diverge with respect to size, amplitude, prevalence, and timing. (A) Examples of Ca2+ signals from five different ROI types. Colored dots represent data points collected at different times after repeated stimuli. Black lines represent the fitted, interpolated signal. Scale bars depict fluorescence changes in percentage of the baseline activity (ΔF/F). (B) Time series of 2-PM images taken in cortical layers II/III in whisker-barrel cortex bulk-loaded with OGB (green) and surface-loaded with SR101 (red). ROIs shown in B: neuronal soma (green), neuropil (blue), astrocytic soma (red), astrocytic process (orange), and astrocytic end-feet (yellow). Sum of Ca2+activity, significantly higher than in the baseline period (>2 FSD), in 110-ms periods before, during, and after the fast Ca2+ response. Statistically significant responses are shown in the Upper row for astrocytic and Lower row for nonastrocytic (neuronal/neuropil) areas. A structure was defined as astrocytic if the SR101 staining was >2 SD of the level in the entire image and if <2 SD classified as non-SR101 pixels. Pixels not evaluated are gray in the images. (C) Mean latency of peak of Ca2+ signal and fEPSP during whisker-pad stimulation. The evoked fEPSP preceded the Ca2+ signals by 60–80 ms, and the neuropil peaked ∼20 ms before other cellular structures (P < 0.001; n = 32 animals). (D) Decay time (tau) of the fast Ca2+ responses in different ROIs. The fast Ca2+ signal lasted longest in neuron soma and neuropil (n = 32 animals, 1-Hz stimulation). (E) The percentage of ROIs responding with a fast Ca2+ signal at 1-Hz stimulation (>2 FSD). Same color code as in D (n = 15 animals). Error bars in SE of proportions. (F) Amplitude of Ca2+ activity in % of baseline. The mean maximum of the ROIs with Ca2+ signal >2 FSD shows the signal to be of equal size in astrocytic and neuronal structures (n = 15 animals). All error bars represent SEM; for number of ROIs included, see Table 1.
Fig. 8.
Fig. 8.
Correlation of Ca2+ signals to fEPSP and cerebral blood flow (CBF) responses. (A) Local field potential from extracellular recording during whisker stimulation. The negative deflection reflects the fEPSP whereas the subsequent positive deflection reflects the inhibitory postsynaptic potential. (B) Examples of blood flow response as recorded with laser-Doppler flowmetry. One brief peak was observed after a single stimulus whereas repeated stimuli create a long-lasting response. Values are in percentage of baseline levels. (C) The summed amplitudes of the fast Ca2+ responses versus the level of synaptic activity as indicated by the summed fEPSP amplitudes. Fast Ca2+ responses correlated linearly to the ∑fEPSP for neuropil (blue, R2 = −0.91, P = 7.6 × 10⁻³) and neuronal soma (green, R2 = −0.95, P = 3.1 × 10⁻³) and astrocytic somas (red, R2 = −0.94, P = 4.2 × 10⁻³) and processes (orange, R2 = −0.89, P = 9.9 × 10⁻³), but not for the end-feet (gray, R2 = −0.34, P = 0.1765) (n = 15 animals, Pearson’s; for number of ROIs included, see Table 1). (D) Correlation analysis of the summed Ca2+ signals versus the normalized CBF response (n = 15 animals) revealed a significant association for astrocyte soma (red, R2 = 0.74, P = 0.039) and end-feet (gray, R2 = 0.94, P = 0.004), but not for neuropil (blue, R2 = 0.46, P = 0.127), neuron soma (green, R2 = 0.59, P = 0.081), or astrocyte processes (orange, R2 = 0.64, P = 0.064) (n = 15 animals, regression analysis). All error bars are SEM.

References

    1. Attwell D, et al. Glial and neuronal control of brain blood flow. Nature. 2010;468(7321):232–243. - PMC - PubMed
    1. Iadecola C, Nedergaard M. Glial regulation of the cerebral microvasculature. Nat Neurosci. 2007;10(11):1369–1376. - PubMed
    1. Koehler RC, Roman RJ, Harder DR. Astrocytes and the regulation of cerebral blood flow. Trends Neurosci. 2009;32(3):160–169. - PubMed
    1. Lauritzen M. Reading vascular changes in brain imaging: Is dendritic calcium the key? Nat Rev Neurosci. 2005;6(1):77–85. - PubMed
    1. Nedergaard M, Rodríguez JJ, Verkhratsky A. Glial calcium and diseases of the nervous system. Cell Calcium. 2010;47(2):140–149. - PubMed

Publication types