. 2013 Nov 11;368(1632):20130018.
doi: 10.1098/rstb.2013.0018. Print 2013 Dec 19.

Low-affinity transcription factor binding sites shape morphogen responses and enhancer evolution

Affiliations

Low-affinity transcription factor binding sites shape morphogen responses and enhancer evolution

Andrea I Ramos et al. Philos Trans R Soc Lond B Biol Sci. .

Abstract

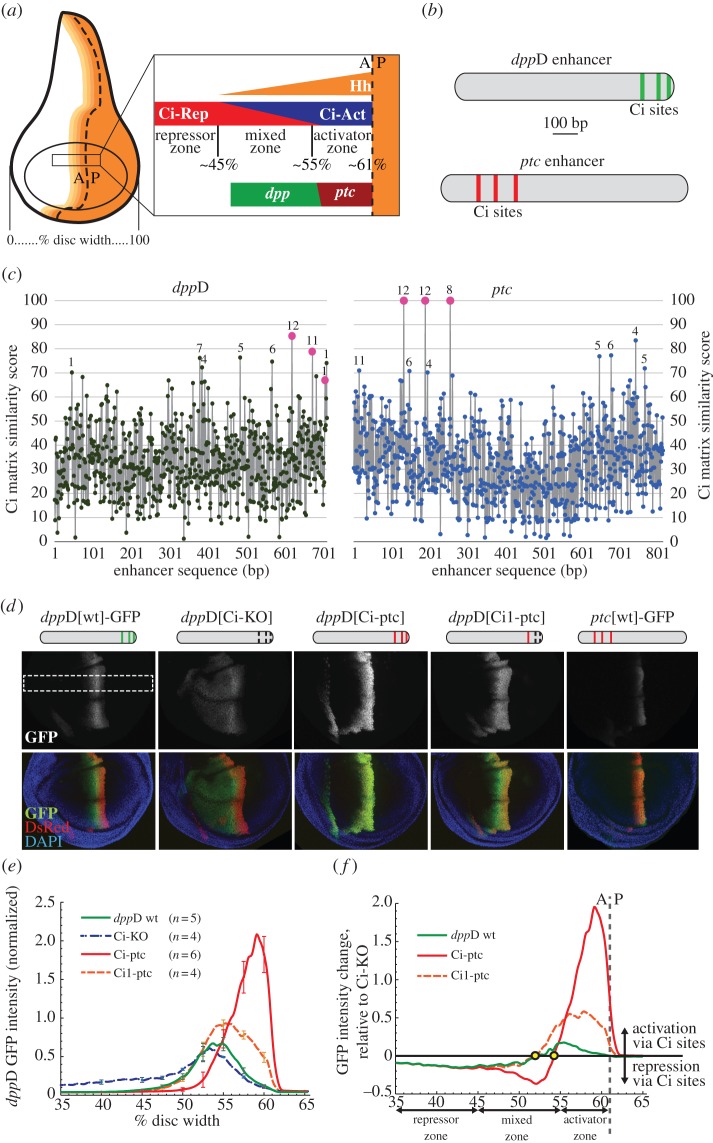
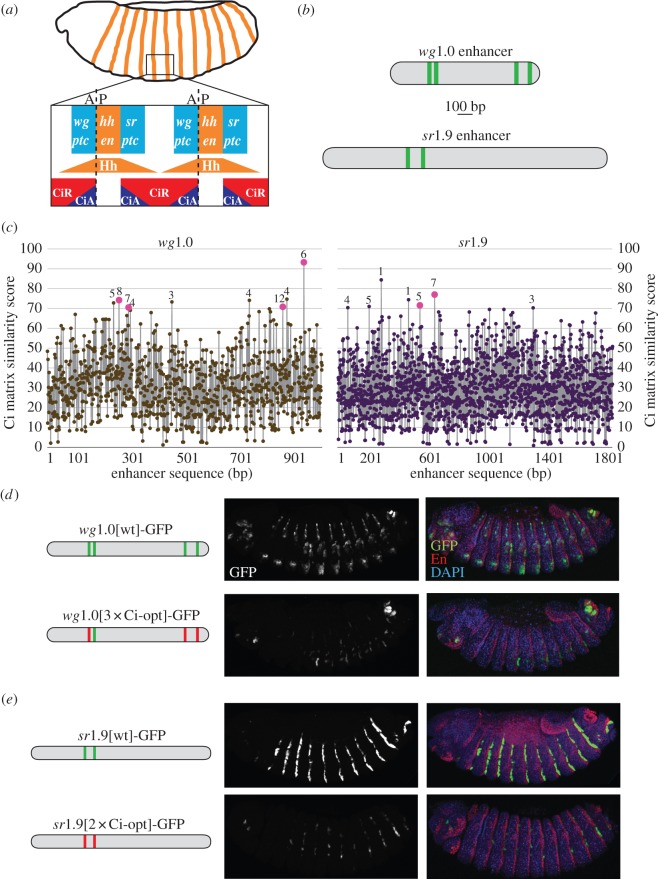
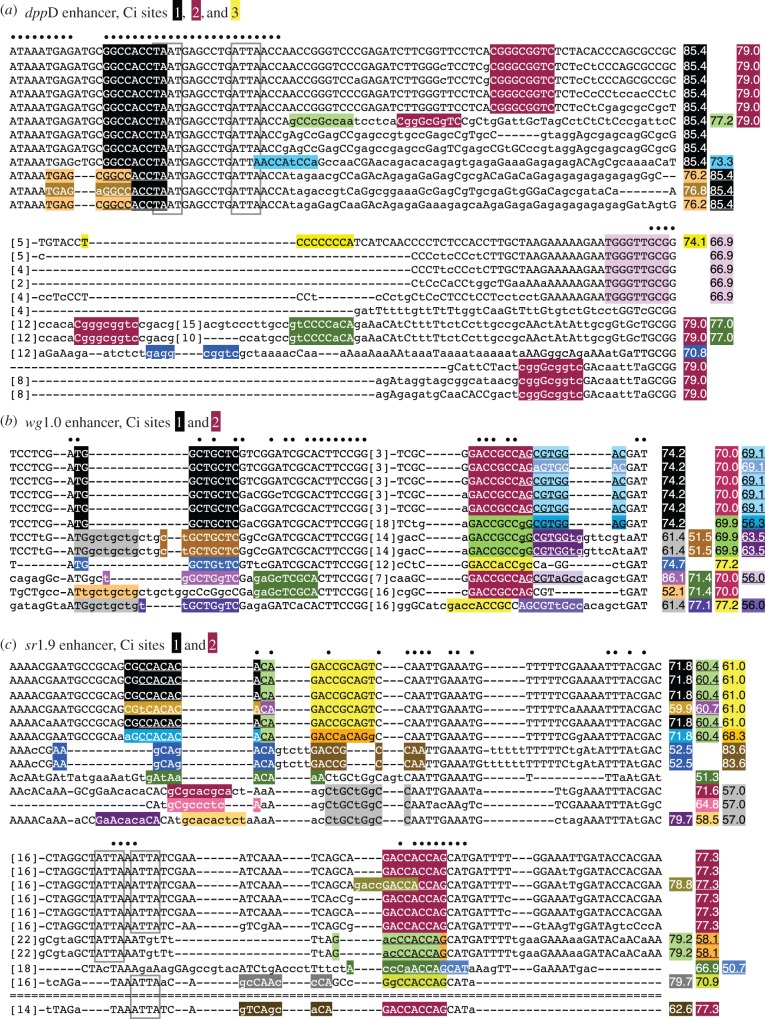
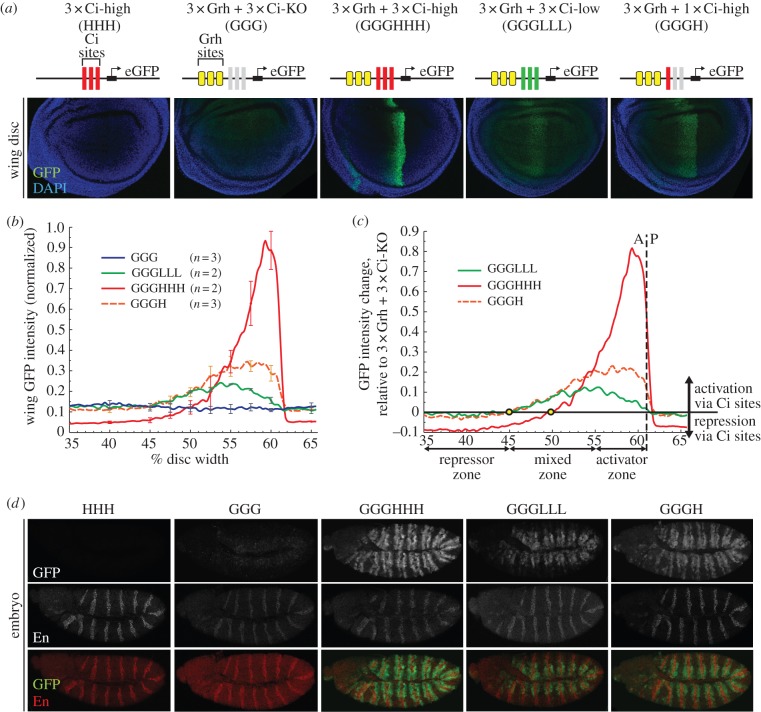
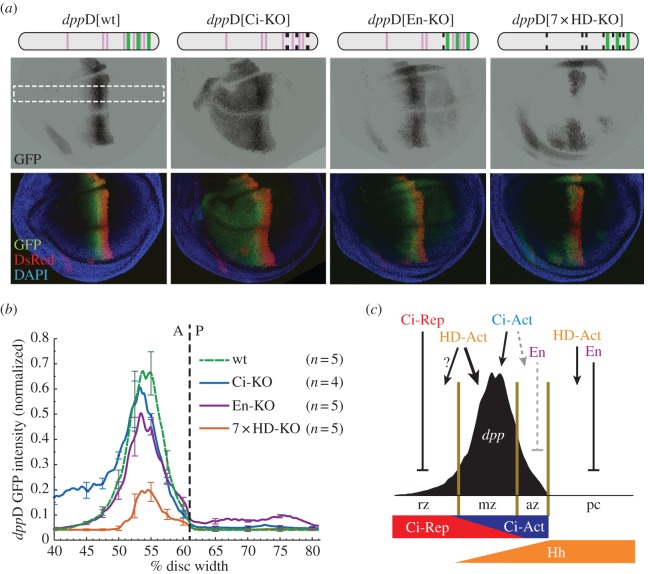
In the era of functional genomics, the role of transcription factor (TF)-DNA binding affinity is of increasing interest: for example, it has recently been proposed that low-affinity genomic binding events, though frequent, are functionally irrelevant. Here, we investigate the role of binding site affinity in the transcriptional interpretation of Hedgehog (Hh) morphogen gradients. We noted that enhancers of several Hh-responsive Drosophila genes have low predicted affinity for Ci, the Gli family TF that transduces Hh signalling in the fly. Contrary to our initial hypothesis, improving the affinity of Ci/Gli sites in enhancers of dpp, wingless and stripe, by transplanting optimal sites from the patched gene, did not result in ectopic responses to Hh signalling. Instead, we found that these enhancers require low-affinity binding sites for normal activation in regions of relatively low signalling. When Ci/Gli sites in these enhancers were altered to improve their binding affinity, we observed patterning defects in the transcriptional response that are consistent with a switch from Ci-mediated activation to Ci-mediated repression. Synthetic transgenic reporters containing isolated Ci/Gli sites confirmed this finding in imaginal discs. We propose that the requirement for gene activation by Ci in the regions of low-to-moderate Hh signalling results in evolutionary pressure favouring weak binding sites in enhancers of certain Hh target genes.

Keywords: Ci/Gli; binding affinity; enhancers; gene regulation; hedgehog signalling; morphogen gradient.


Figures

Figure 1.
Figure 1.
The dppD enhancer requires conserved low-affinity Ci/Gli sites to respond optimally to Hh and Ci in the developing wing. (a) Diagram of the Drosophila third-instar wing imaginal disc, showing the distribution of the Hedgehog signalling gradient across the anterior compartment. The dashed line indicates the anterior–posterior (A/P) boundary separating posterior cells, which secrete Hh, from anterior cells, which express the Ci transcription factor. Magnification of a segment of the wing pouch across the compartment boundary shows distinct zones (repressor, mixed and activator) based on their distance from the source of Hh morphogen. The Hh target genes dpp and ptc respond differently to the gradient; dpp is expressed maximally in the mixed zone, whereas ptc expression is restricted to the activator zone. (b) Ci binding motifs in the dppD and ptc enhancers. (c) Estimated Ci binding affinity and evolutionary conservation across the dppD and ptc enhancers of D. melanogaster. Ci matrix similarity score (see Methods) was plotted for every 9-mer. Known or proposed Ci sites (table 1) are shown as larger dots. For each 9-mer with a score ≥70, numerals indicate the number of Drosophila species (out of 12) in which that sequence is present at or near the orthologous position. (d) Top: diagrams of dppD enhancer constructs, with defined Ci binding sites as vertical bars (broken bars indicate mutated sites). Middle and bottom, confocal images of third-instar larval wing imaginal discs, showing GFP expression driven by dppD-GFP or ptc-GFP reporter transgenes. Red fluorescence is driven by a dppD[Ci-ptc]-DsRed transgene used for GFP fluorescence normalization and positional reference [33]. In dppD[Ci-KO]-GFP, three Ci sites were destroyed by targeted mutation; in dppD[Ci-ptc]-GFP, three Ci sites were converted to optimal motifs taken from ptc; in dppD[Ci1-ptc]-GFP, the 5′ Ci site was optimized, whereas site 2 and 3 were destroyed. The white dashed rectangle indicates the section of the dorsal wing pouch that is measured in the following panels. (e) Normalized GFP fluorescence data collected from the dorsal section of the wing pouch. Error bars indicate 1 s.d. (f) Net effect of wild-type or high-affinity Ci sites on dppD expression (calculated as the normalized transgene expression of dppD[wt] or dppD[Ci-ptc] minus normalized dppD[Ci-KO] expression). Circles indicate the positions on the A/P axis at which Ci input switches from net activation to net repression for each enhancer. (Online version in colour.)
Figure 2.
Figure 2.
Optimizing the Ci binding affinity in the wingless and stripe embryonic enhancers results in reduced levels of gene expression. (a) Diagram of a stage 14 Drosophila embryo. A closer view of parasegments 5 and 6 shows bidirectional Hh signalling gradients that modulate the transcriptional activity of Ci. Known Hh/Ci target genes respond symmetrically (patched [71,72]) or asymmetrically (e.g. wingless (wg) [73] and stripe (sr) [44]) to the Hh signal. (b) Diagrams of the wg1.0[wt] and sr1.9[wt] enhancers showing Ci binding motifs as vertical lines. (c) Estimated Ci binding affinity across the wg1.0 and sr1.9 enhancers of D. melanogaster. Ci matrix similarity scores and conservation data are indicated as in figure 1c. In (d,e), diagrams on the left show wg1.0 and sr1.9D enhancer constructs; images of transgenic embryos show GFP alone (middle) and merged GFP, En (which marks Hh-producing cells), and DAPI nuclear stain (right). (d) Confocal images of stage 14 transgenic embryos carrying wg1.0[wt] and wg1.0[3xCi-opt], in which three Ci sites have been converted to optimal Ci binding motifs, driving GFP. (e) Confocal images of stage 14 transgenic embryos carrying sr1.9[wt] and sr1.9[2xCi-opt], in which two Ci sites have been converted into optimal Ci binding motifs, driving GFP. A, anterior; P, posterior. (Online version in colour.)
Figure 3.
Figure 3.
Evolutionary conservation of predicted binding affinity, but not of sequence identity, at many low-to-moderate-affinity Ci binding sites. Twelve-species Drosophila sequence alignments are shown for selected regions of the (a) dppD, (b) wg1.0 and (c) sr1.9 enhancers. Selected 9-mers are shaded, and Ci matrix similarity scores for those motifs are shown to the right. Sequences are from the following Drosophila species, from top to bottom: D. melanogaster, D. simulans, D. sechellia, D. yakuba, D. erecta, D. ananassae, D. pseudoobscura, D. persimilis, D. willistoni, D. virilis, D. mojavensis and D. grimshawi. Dashes indicate gaps; double-dashes indicate a lack of alignable sequence. Bracketed numbers indicate the number of bases deleted at that position to conserve space. Conserved homeodomain binding motifs are in grey boxes. (Online version in colour.)
Figure 4.
Figure 4.
Hedgehog gradient responses of synthetic enhancers in the wing and embryo. (a) Diagrams of synthetic transgenic reporters, with Grainyhead (Grh) sites and low-affinity, high-affinity, and mutant Ci sites indicated. Confocal images of the pouch regions of wing imaginal discs from transgenic third-instar larvae are shown. GFP fluorescence data are internally normalized to a dppD[Ci-ptc]-DsRed reference transgene (not shown). (b) Normalized GFP fluorescence wing data across the dorsal wing pouch. Error bars indicate one standard deviation. (c) Net effect of Ci sites on synthetic transgene expression (normalized GFP expression minus normalized GGG-GFP expression). Circles indicate the positions at which Ci input switches from net activation to net repression. (d) Confocal images of stage 11 transgenic embryos carrying the same synthetic GFP reporters. Top, GFP expression; middle, Engrailed (En) antibody, which marks Hh-producing cells; bottom, merge. (Online version in colour.)
Figure 5.
Figure 5.
Conserved homeodomain (HD) binding motifs integrate regulatory inputs into dppD. (a) Top: diagrams of dppD enhancer constructs, with defined Ci and HD binding sites as vertical bars (wide bars, wild-type low-affinity Ci binding sites; narrow bars, HD motifs; broken bars, mutated sites). Middle and bottom: confocal images of wing imaginal discs from transgenic third-instar larvae are shown. Middle, GFP alone; bottom, GFP merged with dppD[Ci-ptc]-DsRed reference transgene and DAPI nuclear stain. (b) Normalized GFP fluorescence data from transgenic dorsal wing pouches. Error bars indicate 1 s.d. Dashed line shows A/P compartment boundary. (c) Proposed model of the dppD regulatory network across the wing A/P axis. A, anterior; P, posterior; pc, posterior compartment. (Online version in colour.)

References

    1. Levine M. 2010. Transcriptional enhancers in animal development and evolution. Curr. Biol. 20, R754–R763 (doi:10.1016/j.cub.2010.06.070) - DOI - PMC - PubMed
    1. Stamatoyannopoulos JA. 2012. What does our genome encode? Genome Res. 22, 1602–1611 (doi:10.1101/gr.146506.112) - DOI - PMC - PubMed
    1. Ong C-T, Corces VG. 2011. Enhancer function: new insights into the regulation of tissue-specific gene expression. Nat. Rev. Genet. 12, 283–293 (doi:10.1038/nrg2957) - DOI - PMC - PubMed
    1. Göke J, Jung M, Behrens S, Chavez L, O'Keeffe S, Timmermann B, Lehrach H, Adjaye J, Vingron M. 2011. Combinatorial binding in human and mouse embryonic stem cells identifies conserved enhancers active in early embryonic development. PLoS Comput. Biol. 7, e1002304 (doi:10.1371/journal.pcbi.1002304) - DOI - PMC - PubMed
    1. Shen Y, et al. 2012. A map of the cis-regulatory sequences in the mouse genome. Nature 488, 116–120 (doi:10.1038/nature11243) - DOI - PMC - PubMed

Publication types

MeSH terms

LinkOut - more resources