

doi: 10.1080/87565641.2011.637589.
Normative topographic ERP analyses of speed of speech processing and grammar before and after grammatical treatment
Affiliations
- PMID: 24219693
- PMCID: PMC3873727
- DOI: 10.1080/87565641.2011.637589
Item in Clipboard
Normative topographic ERP analyses of speed of speech processing and grammar before and after grammatical treatment
Dev Neuropsychol.
2013.
Abstract
Typically developing (TD) preschoolers and age-matched preschoolers with specific language impairment (SLI) received event-related potentials (ERPs) to four monosyllabic speech sounds prior to treatment and, in the SLI group, after 6 months of grammatical treatment. Before treatment, the TD group processed speech sounds faster than the SLI group. The SLI group increased the speed of their speech processing after treatment. Posttreatment speed of speech processing predicted later impairment in comprehending phrase elaboration in the SLI group. During the treatment phase, change in speed of speech processing predicted growth rate of grammar in the SLI group.
Figures
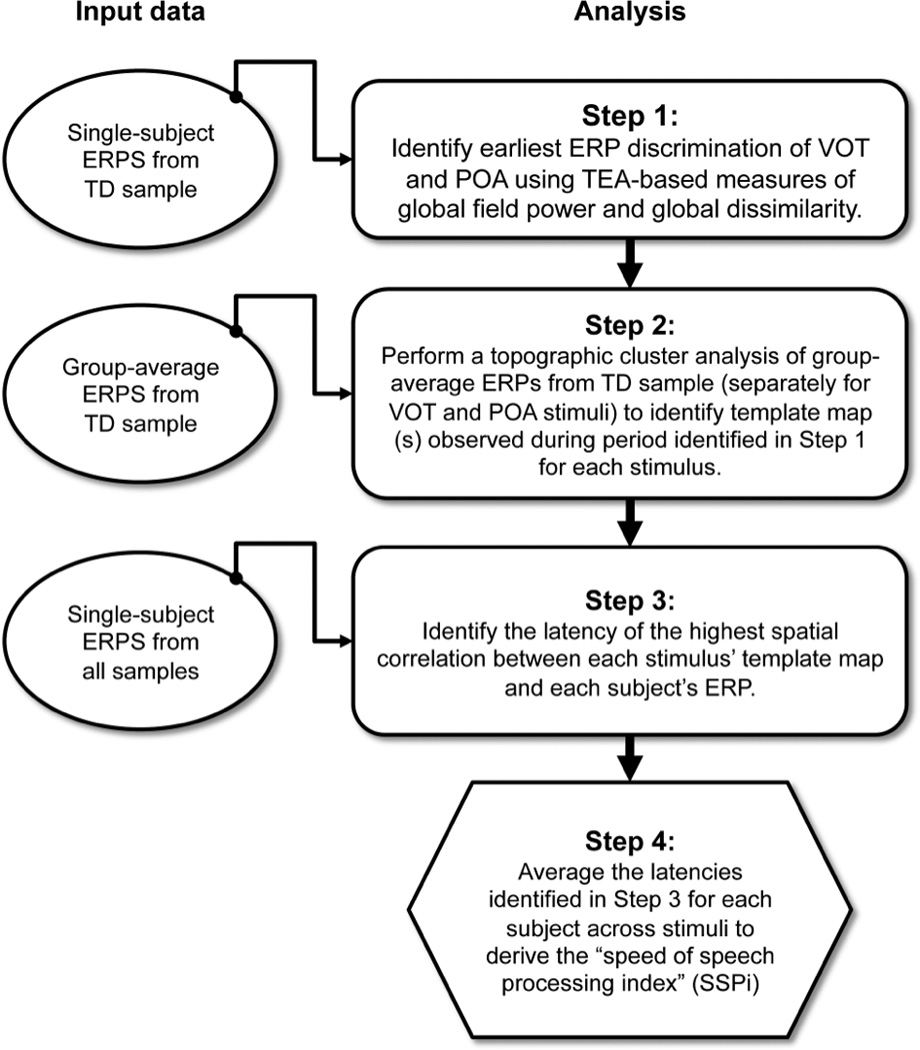
Flowchart of process used to derive speed of speech processing index. The left side of the flowchart indicates the input data for each of the analyses described on the right side of the flowchart.
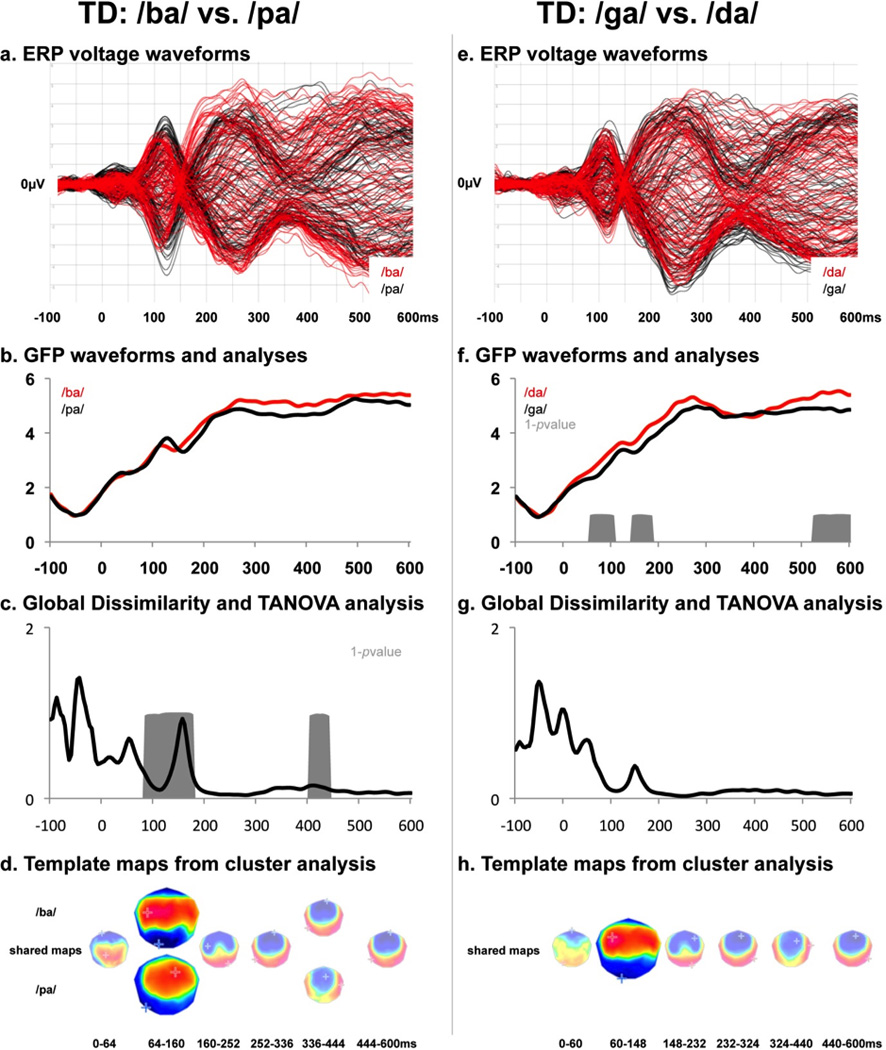
Results of the TEA of TD sample for the place of articulation (POA) and voice onset time (VOT) comparisons. Panels a and e display the group-averaged ERP across the electrode montage as a butterfly plot (i.e. with all voltage waveforms superimposed). Panels b and f display the group-averaged global field power (GFP) waveforms with gray areas indicative of significant differences using a paired t-test (p<0.05 for minimally 11 consecutive time samples). Panels c and g display the global dissimilarity (DISS) of the group-average ERPs as well as periods of significant topographic differences based on a Monte Carlo permutation analysis (gray areas; p<0.05 for minimally 11 consecutive time samples). Panels d and h display the results of the topographic cluster analysis performed on the group-averaged ERPs for each comparison separately, as well as the time period when a given template map was observed in the group-average ERPs. Maps are 2D projections with left hemiscalp on the left and nasion upwards. Maps are individually scaled to their maximum/minimum voltages, which are are indicated by red and blue crosses, respectively. Those template maps observed during the earliest period of significant differences in either GFP or DISS are highlighted.
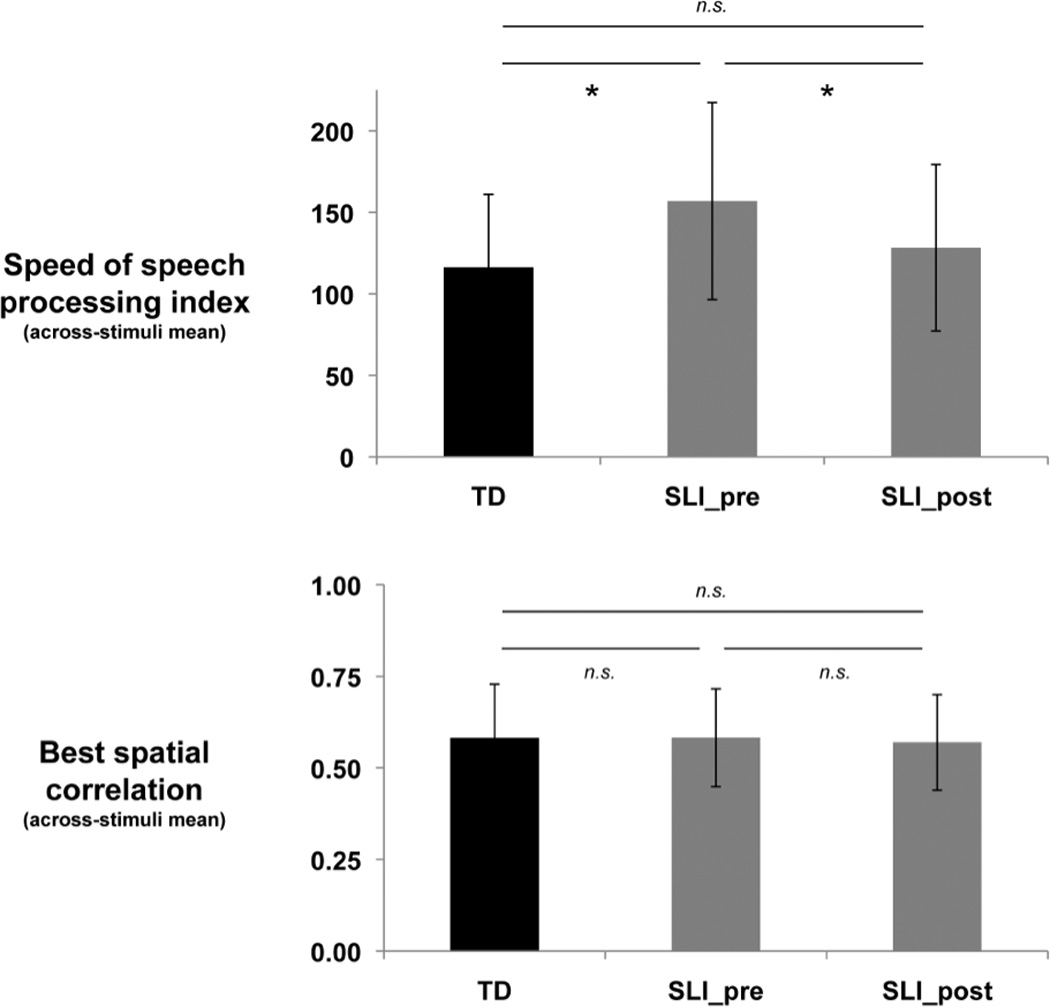
Analyses of speed of speech processing indices. The top panel displays the mean (±1 SD indicated) speed of speech processing indices, while the bottom panel displays the mean (±1 SD indicated) best spatial correlation. Data are shown from both the TD and SLI sample, as well as at both pre-treatment and post-treatment measurements in the case of the SLI sample.

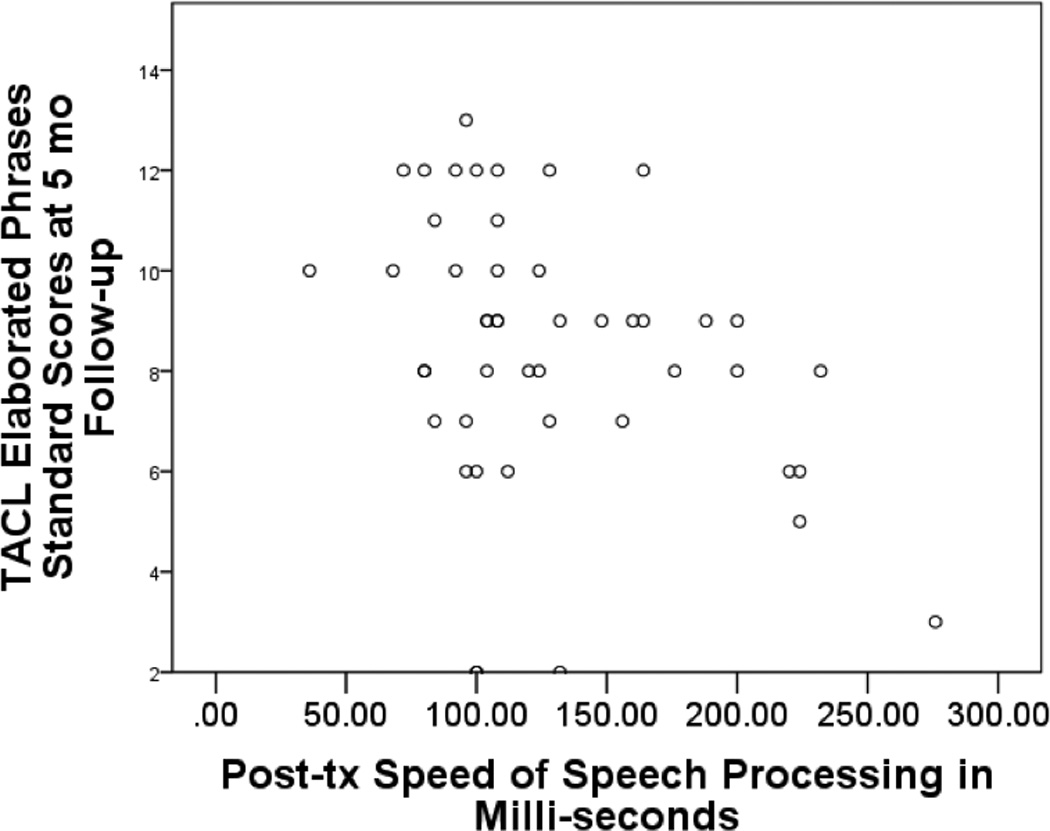
(a) Predictive value of post-treatment TEA-derived speed of speech processing and subsequent impairment in comprehension of phrase elaboration in SLI group, (b) Grammatical growth as a function of proportional change in speed of speech processing in SLI group during the treatment phase.
(a) Predictive value of post-treatment TEA-derived speed of speech processing and subsequent impairment in comprehension of phrase elaboration in SLI group, (b) Grammatical growth as a function of proportional change in speed of speech processing in SLI group during the treatment phase.
References
-
- Benasich A, Leevers H. Processing of rapidly presented auditory cues in infancy: Implications for later language development. In: Hayne H, Fagan J, editors. Progress in Infancy Research. Vol. 3. Mahwah, NJ: Lawrence Erlbaum Assoc; 2003. pp. 245–288.
-
- Bishop D, Bishop S, Bright P, James C, Delaney T, Tallal P. Different origin of auditory and phonological processing problems in children with language impairment: Evidence from a twin study. Journal of Speech, Language, and Hearing Research. 1999b;42:155–168. - PubMed
-
- Bishop DV, Carlyon RP, Deeks JM, Bishop SJ. Auditory temporal processing impairment: Neither necessary nor sufficient for causing language impairment in children. Journal of Speech, Language, and Hearing Research. 1999a;42:1295–1310. - PubMed
-
- Carrow-Woolfolk E. Test of Auditory Comprehension of Language. 3rd edition. Austin, TX: Pro-Ed; 1999.
Publication types
MeSH terms
Grants and funding
LinkOut - more resources
Full Text Sources
Other Literature Sources