. 2013 Dec 20;288(51):36741-9.
doi: 10.1074/jbc.M113.493221. Epub 2013 Nov 12.

Mutation for nonsyndromic mental retardation in the trans-2-enoyl-CoA reductase TER gene involved in fatty acid elongation impairs the enzyme activity and stability, leading to change in sphingolipid profile

Affiliations

Mutation for nonsyndromic mental retardation in the trans-2-enoyl-CoA reductase TER gene involved in fatty acid elongation impairs the enzyme activity and stability, leading to change in sphingolipid profile

Kensuke Abe et al. J Biol Chem. .

Abstract

Very long-chain fatty acids (VLCFAs, chain length >C20) exist in tissues throughout the body and are synthesized by repetition of the fatty acid (FA) elongation cycle composed of four successive enzymatic reactions. In mammals, the TER gene is the only gene encoding trans-2-enoyl-CoA reductase, which catalyzes the fourth reaction in the FA elongation cycle. The TER P182L mutation is the pathogenic mutation for nonsyndromic mental retardation. This mutation substitutes a leucine for a proline residue at amino acid 182 in the TER enzyme. Currently, the mechanism by which the TER P182L mutation causes nonsyndromic mental retardation is unknown. To understand the effect of this mutation on the TER enzyme and VLCFA synthesis, we have biochemically characterized the TER P182L mutant enzyme using yeast and mammalian cells transfected with the TER P182L mutant gene and analyzed the FA elongation cycle in the B-lymphoblastoid cell line with the homozygous TER P182L mutation (TER(P182L/P182L) B-lymphoblastoid cell line). We have found that TER P182L mutant enzyme exhibits reduced trans-2-enoyl-CoA reductase activity and protein stability, thereby impairing VLCFA synthesis and, in turn, altering the sphingolipid profile (i.e. decreased level of C24 sphingomyelin and C24 ceramide) in the TER(P182L/P182L) B-lymphoblastoid cell line. We have also found that in addition to the TER enzyme-catalyzed fourth reaction, the third reaction in the FA elongation cycle is affected by the TER P182L mutation. These findings provide new insight into the biochemical defects associated with this genetic mutation.

Keywords: Fatty Acid; Fatty Acid Metabolism; Lipids; Membrane; Sphingolipid.


Figures
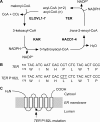
FIGURE 1.
FIGURE 1.
The FA elongation cycle and the TER P182L mutation. A, the FA elongation cycle consisting of four reactions (condensation, reduction, dehydration, and reduction) and the mammalian enzymes involved in each reaction are illustrated. Each elongation cycle adds two carbons from malonyl-CoA to a growing acyl-CoA chain. B, nucleotide and amino acid sequences of the TER enzyme and the TER P182L mutant enzyme around the mutation site are presented. C, the predicted membrane topology of the TER enzyme with the P182L mutation site (*) is shown. The prediction was made based on the topology of the yeast and Arabidopsis homologs (20).
FIGURE 2.
FIGURE 2.
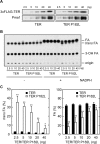
The TER P182L mutant enzyme complements the IAA-induced growth defect of the yeast TSC13-HA-AID cells. A and B, yeast YRF82 cells (TSC13-HA-AID) bearing the pAKNF314 (vector), pAB85 (3×FLAG-TER), or pAB95 (3×FLAG-TER P182L) plasmid were grown in SC-Trp medium at 30 °C to full growth. A, after 1:10 serial dilution, cells were spotted onto plates of SC-Trp and incubated with or without 150 μm IAA (500 mm stock solution in ethanol) at 30 °C for 3 days. The dilution factors are indicated above the panel. B, cells were diluted with SC-Trp medium to A600 = 0.3 and incubated at 30 °C for 2 h. Cells were then treated with 500 μm IAA (500 mm stock solution in ethanol) or with its solvent ethanol and further incubated at 30 °C for 3 h. The total lysate was prepared from each transfected cell population, and the lysate equivalent to A600 = 0.2 or 1.0 (5×) units of cells was separated by SDS-PAGE and immunoblotted with anti-FLAG antibody and anti-HA antibody or, to compare protein loading, with anti-Pgk1 antibody.
FIGURE 3.
FIGURE 3.
The activity of the TER P182L mutant enzyme is lower than that of the wild-type TER enzyme. A–C, yeast ABY62 cells (tsc13Δ mutant harboring the pAB114 (3×FLAG-TER) plasmid) and ABY58 cells (tsc13Δ mutant harboring the pAB110 (3×FLAG-TER P182L) plasmid) were grown in SC-His medium at 30 °C. An increasing amount of the total membrane fraction was subjected to immunoblotting (A) or in vitro trnas-2-enoyl-CoA reductase assay (B and C): for cells expressing the 3×FLAG-TER enzyme, 0.625, 1.25, 2,5, 5, and 10 μg, and for cells expressing the 3×FLAG-TER P182L mutant enzyme, 1.25, 2,5, 5, 10, and 20 μg (corresponding respectively to 2.5, 5, 10, 20, and 40 ng of the 3×FLAG-TER enzyme as determined by comparison with the 3×FLAG-tagged maltose-binding protein standard, which are indicated in the figure). A, each total membrane fraction was separated by SDS-PAGE and immunoblotted with anti-FLAG antibody or, to compare protein loading, with anti-Pma1 (a plasma membrane protein) antibody. B, each total membrane fraction was incubated with 1.8 μm 3-hydroxy[1-14C]palmitoyl-CoA (5 nCi) at 37 °C for 30 min. After a sequential work-up (see ”Experimental Procedures“), lipids were separated by normal-phase TLC and detected by autoradiography. trans FA, trans-2-enoyl FA; 3-OH FA, 3-hydroxy FA. C, the radioactivities associated with 3-hydroxy-acyl FA, trans-2-enoyl FA, and FA in B were quantified by a bioimaging analyzer BAS-2500. Each bar represents the percentage of the radioactivity of trans-2-enoyl FA (left graph) or FA (right graph) relative to the total radioactivity and the mean ± S.D. of three independent experiments. Statistically significant differences between the activities of the TER enzyme and the TER P182L mutant enzyme at the same protein amount are indicated (*, p < 0.05, **, p < 0.01; Student's t test).
FIGURE 4.
FIGURE 4.
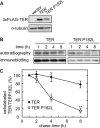
The TER P182L mutant enzyme is unstable. A, HEK 293T cells were transfected with the pCE-puro 3×FLAG-1 (vector), pCE-puro 3×FLAG-TER, or pCE-puro 3×FLAG-TER P182L plasmid. Forty-eight hours after transfection, the total lysate (5 μg) prepared from each transfected cell population was separated by SDS-PAGE and subjected to immunoblotting with anti-FLAG antibody or, to demonstrate uniform protein loading, with anti-α-tubulin antibody. B, HEK 293T cells were transfected with the pCE-puro 3×FLAG-TER or pCE-puro 3×FLAG-TER P182L plasmid. Forty-eight hours after transfection, cells were labeled with [35S]Met/Cys at 37 °C for 1 h. After changing the medium to remove [35S]Met/Cys, cells were incubated for another 1, 2, 4, and 8 h. At the end of each incubation time, the total cell lysate was prepared and subjected to immunoprecipitation with anti-FLAG antibody. The precipitate was separated by SDS-PAGE and analyzed by autoradiography and by immunoblotting with anti-FLAG antibody. C, the radioactivities associated with the TER enzyme and the TER P182L mutant enzyme in B were quantified by a bioimaging analyzer BAS-2500. Each value represents the percentage of the radioactivity of the TER enzyme or the TER P182L mutant enzyme relative to its radioactivity at the 1-h chase point and the mean ± S.D. of three independent experiments. Statistically significant differences between the radioactivities of the TER enzyme and the TER P182L mutant enzyme at the same chase point are indicated (*, p < 0.05, **, p < 0.01; Student's t test).
FIGURE 5.
FIGURE 5.
The TER P182L mutant enzyme is localized in the ER. HeLa cells were transfected with the pCE-puro 3×FLAG-1 (vector), pCE-puro 3×FLAG-TER, or pCE-puro 3×FLAG-TER P182L plasmid. Forty-eight hours after transfection, the transfected cells were fixed with formaldehyde and permeabilized with 0.1% Triton X-100. The cells were stained with anti-FLAG antibody (red, left panel), anti-calreticulin antibody (green, middle panel), and the DNA-staining reagent DAPI (blue, right panel). Calibration bar, 10 μm.
FIGURE 6.
FIGURE 6.
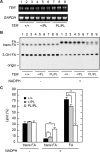
The TERP182L/P182L B-LCL exhibits lower trans-2-enoyl-CoA reductase activity as compared with the TER+/+ B-LCL. A–C, three B-LCL clones were used for each TER genotype: for TER+/+, clone CONT_1 (lane 1 in A and B), clone CONT_2 (lane 2 in A and B), and clone CONT_3 (lane 3 in A and B); for TER+/P182L, clone NSMRC_1 (lane 4 in A and B), clone NSMRC_2 (lane 5 in A and B), and clone NSMRC_3 (lane 6 in A and B); and for TERP182L/P182L, clone NSMR_1 (lane 7 in A and B), clone NSMR_2 (lane 8 in A and B), and clone NSMR_3 (lane 9 in A and B). A, the TER and GAPDH cDNAs were amplified by RT-PCR from the total RNA prepared from each B-LCL clone using a specific primer. The amplified fragments were separated by agarose gel electrophoresis and stained with ethidium bromide. PL, P182L. B, the total membrane fraction (20 μg) prepared from each B-LCL clone was incubated with 1.8 μm 3-hydroxy[1-14C]palmitoyl-CoA (5 nCi) in the presence or absence of 1 mm NADPH at 37 °C for 30 min. After a sequential work-up (see ”Experimental Procedures“), lipids were separated by normal-phase TLC and detected by autoradiography. trans FA, trans-2-enoyl FA; 3-OH FA, 3-hydroxy FA. C, the radioactivities associated with 3-hydroxy-acyl FA, trans-2-enoyl FA, and FA in B were quantified by a bioimaging analyzer BAS-2500. Each bar represents the percentage of the radioactivity of trans-2-enoyl FA or FA relative to the total radioactivity and the mean ± S.D. of three clones. Statistically significant differences are indicated (*, p < 0.05, **, p < 0.01; Student's t test).
FIGURE 7.
FIGURE 7.
3-Hydroxyacyl-CoA is accumulated in the TERP182L/P182L membrane in the FA elongation assay. A, three B-LCL clones were used for each TER genotype: for TER+/+, clone CONT_1 (lane 1), clone CONT_2 (lane 2), and clone CONT_3 (lane 3); for TER+/P182L, clone NSMRC_1 (lane 4), clone NSMRC_2 (lane 5), and clone NSMRC_3 (lane 6); and for TERP182L/P182L, clone NSMR_1 (lane 7), clone NSMR_2 (lane 8), and clone NSMR_3 (lane 9). The total membrane fraction (20 μg) prepared from each B-LCL clone was incubated with 20 μm palmitoyl-CoA and 27.3 μm [2-14C]malonyl-CoA (0.075 μCi) at 37 °C for 30 min. After a sequential work-up (see ”Experimental Procedures“), lipids were separated by normal-phase TLC and detected by a bioimaging analyzer BAS-2500. B, the radioactivities associated with 3-hydroxy-acyl FA, trans-2-enoyl FA, and FA in A were quantified by a bioimaging analyzer BAS-2500. Each bar represents the percentage of the radioactivity of each lipid relative to the total radioactivity and the mean ± S.D. of three independent experiments. Statistically significant differences are indicated (*, p < 0.05; Student's t test). trans FA, trans-2-enoyl FA; 3-OH FA, 3-hydroxy FA.
FIGURE 8.
FIGURE 8.
C24:1 sphingomyelin and C24:1 ceramide are decreased in the TERP182L/P182L B-LCL. Lipids were extracted from multiple cells for each B-LCL clone: for TER+/+, clones CONT_1, CONT_2, and CONT_3; for TER+/P182L, clones NSMRC_1, NSMRC_2, NSMRC_3, and NSMRC_4; and for TERP182L/P182L, NSMR_1, NSMR_2, NSMR_3, and NSMR_4. Sphingomyelin (A), ceramide (B), and hexosylceramide (C) compositions were identified by a 4000 QTRAP MS/MS system and analyzed by Analyst software. Each bar represents the percentage of the amount of each sphingolipid species relative to the total amount of the each corresponding sphingolipid and the mean ± S.D. from three or four clones. Statistically significant differences are indicated (*, p < 0.05, **, p < 0.01; Student's t test).

References

    1. Agbaga M. P., Mandal M. N., Anderson R. E. (2010) Retinal very long-chain PUFAs: new insights from studies on ELOVL4 protein. J. Lipid Res. 51, 1624–1642 - PMC - PubMed
    1. Guillou H., Zadravec D., Martin P. G., Jacobsson A. (2010) The key roles of elongases and desaturases in mammalian fatty acid metabolism: Insights from transgenic mice. Prog. Lipid Res. 49, 186–199 - PubMed
    1. Kihara A. (2012) Very long-chain fatty acids: elongation, physiology and related disorders. J. Biochem. 152, 387–395 - PubMed
    1. Nugteren D. H. (1965) The enzymic chain elongation of fatty acids by rat-liver microsomes. Biochim. Biophys. Acta 106, 280–290 - PubMed
    1. Ohno Y., Suto S., Yamanaka M., Mizutani Y., Mitsutake S., Igarashi Y., Sassa T., Kihara A. (2010) ELOVL1 production of C24 acyl-CoAs is linked to C24 sphingolipid synthesis. Proc. Natl. Acad. Sci. U.S.A. 107, 18439–18444 - PMC - PubMed

Publication types

MeSH terms

Supplementary concepts