. 2013 Dec;15(12):1696-709.
doi: 10.1093/neuonc/not136. Epub 2013 Nov 11.

Impact of MACC1 on human malignant glioma progression and patients' unfavorable prognosis

Affiliations

Impact of MACC1 on human malignant glioma progression and patients' unfavorable prognosis

Carsten Hagemann et al. Neuro Oncol. 2013 Dec.

Abstract

Background: Metastasis-associated in colon cancer 1 (MACC1) has been established as an independent prognostic indicator of metastasis formation and metastasis-free survival for patients with colon cancer and other solid tumors. However, no data are available concerning MACC1 expression in human astrocytic tumors. Glioblastoma multiforme (GBM) is the most prevalent primary brain tumor of adulthood, and due to its invasive and rapid growth, patients have unfavorable prognoses. Although these tumors rarely metastasize, their invasive and migratory behavior is similar to those of metastatic cells of tumors of different origin. Thus, we hypothesized that MACC1 may be involved in progression of human gliomas.

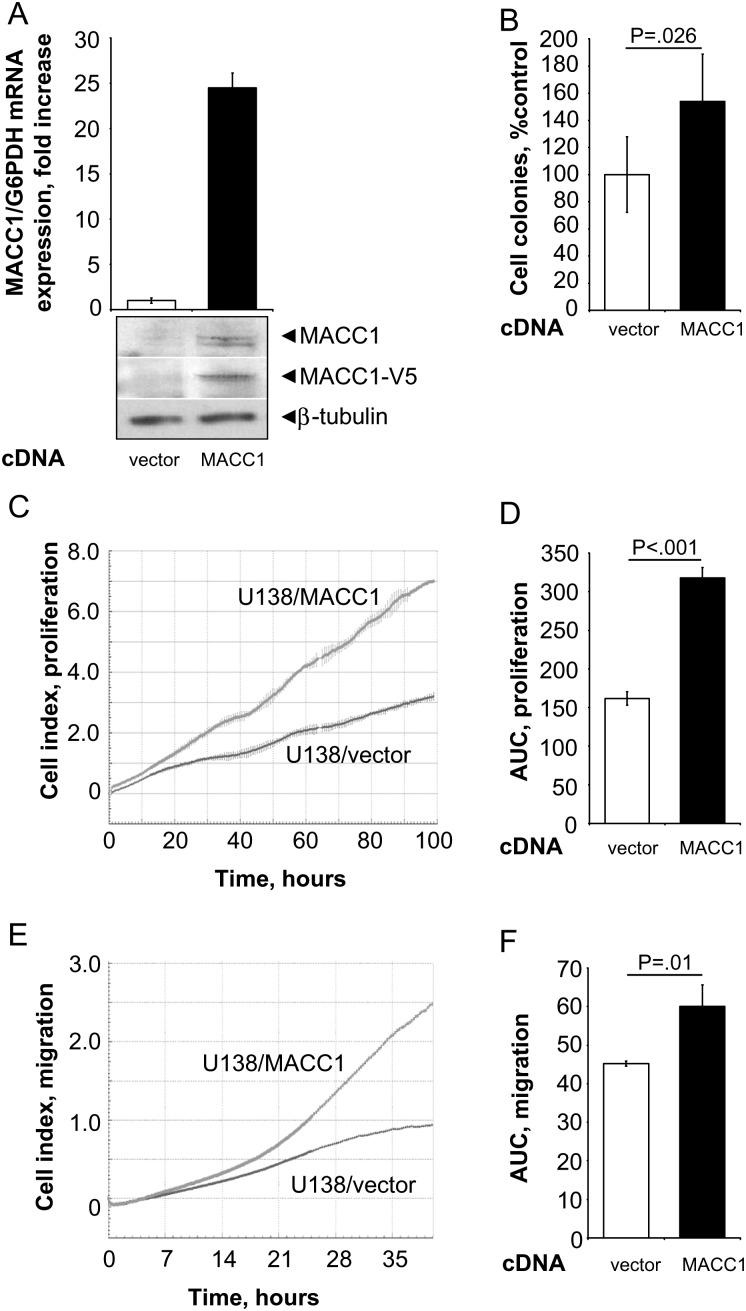
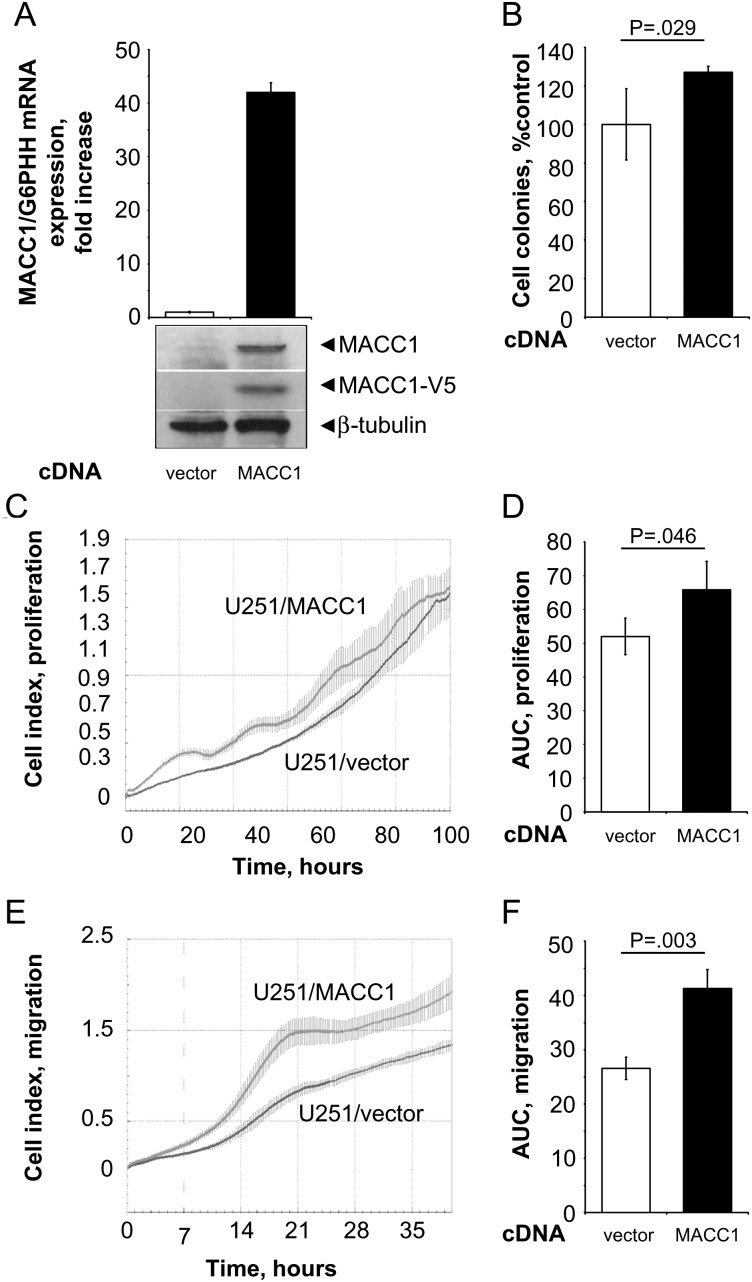
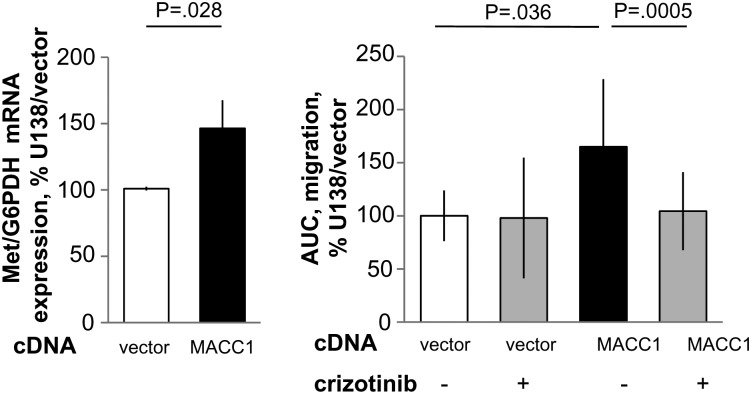
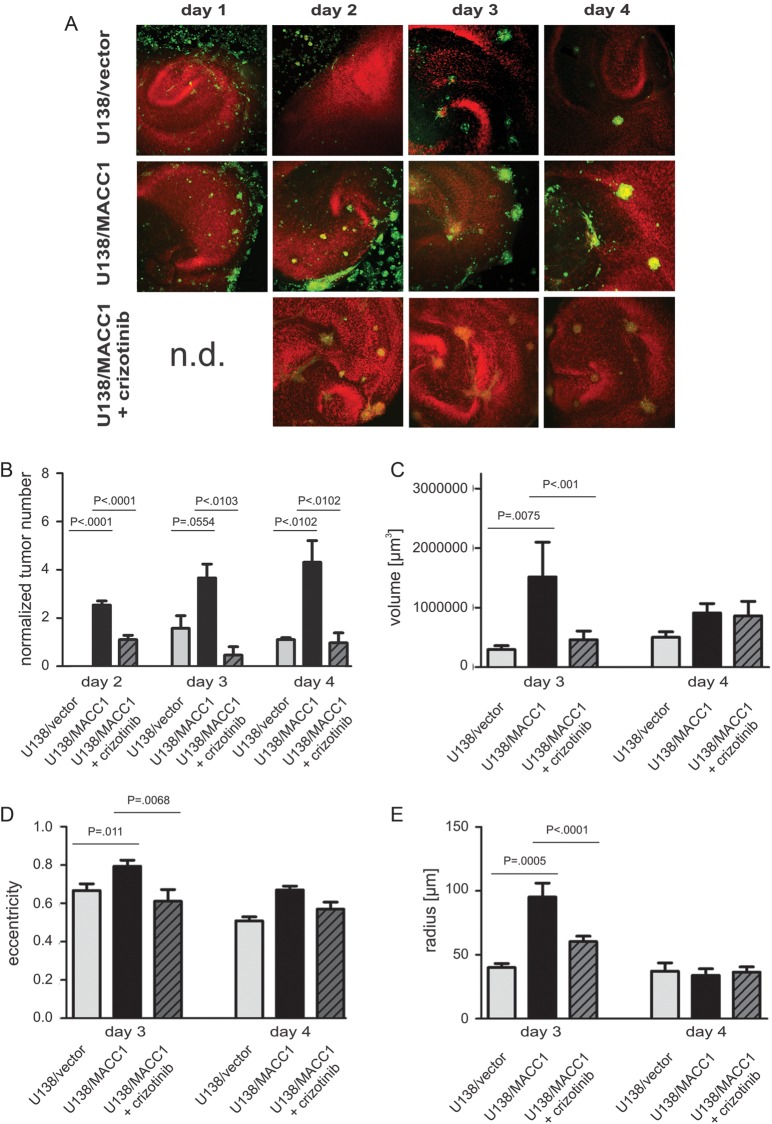
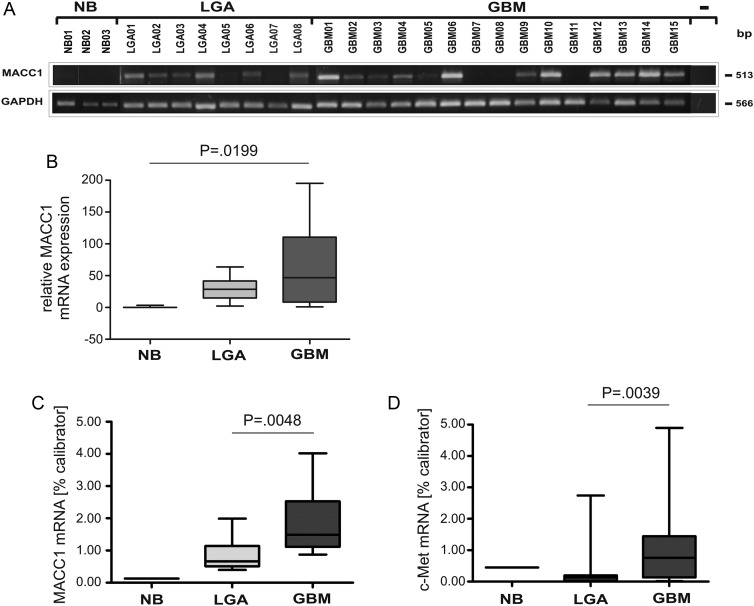
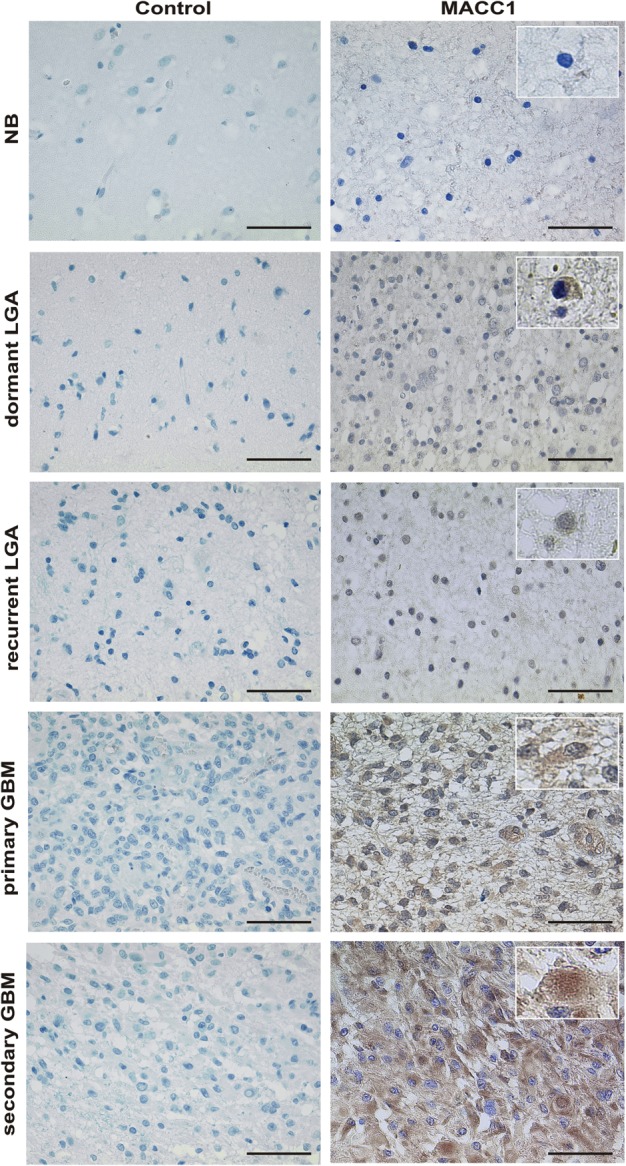
Methods: We performed real-time measurements of proliferation and migration in MACC1-transfected GBM cell lines (U138, U251) and evaluated tumor formation in organotypic hippocampal slice cultures of mice. Semiquantitative and quantitative real-time reverse transcription PCR analyses were performed for MACC1 and for its transcriptional target c-Met in human astrocytoma of World Health Organization grade II (low-grade astrocytoma) and GBM biopsies. Data were validated by MACC1 immunohistochemistry in independent matched samples of low-grade astrocytoma and GBM.

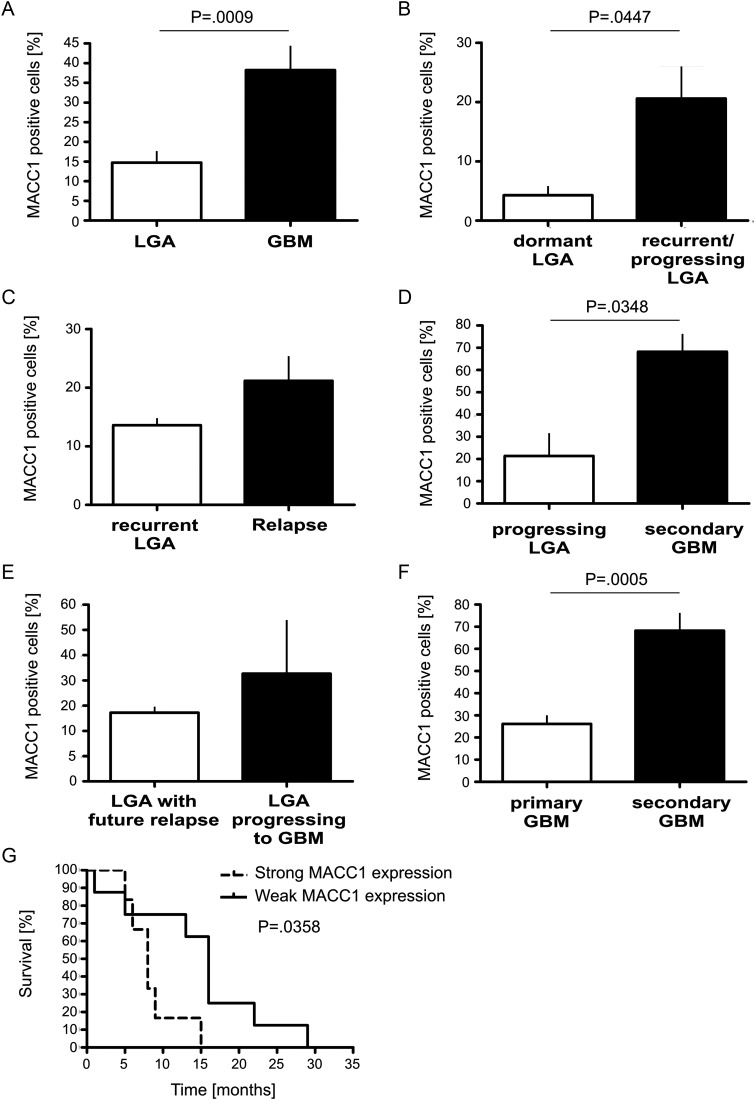
Results: MACC1 increases the proliferative, migratory, and tumor-formation abilities of GBM cells. The c-Met inhibitor crizotinib reduced MACC1-induced migration and tumor formation in organotypic hippocampal slice cultures of mice. Analyzing patients' biopsies, MACC1 expression increased concomitantly with increasing World Health Organization grade. Moreover, MACC1 expression levels allowed discrimination of dormant and recurrent low-grade astrocytomas and of primary and secondary GBM. Strong MACC1 expression correlated with reduced patient survival.

Conclusions: MACC1 may represent a promising biomarker for prognostication and a new target for treatment of human gliomas.

Keywords: MACC1; astrocytoma WHO grade II; glioblastoma multiforme; prognostication; progression.


Figures

Fig. 1.
Fig. 1.
Real-time measurements of cell migration and proliferation in the MACC1-overexpressing GBM cell line U138. (A) The human GBM cell line U138 was stably transfected with pcDNA3.1/MACC1. Overexpression of MACC1 was determined by quantitative real-time RT-PCR, as well as by Western blotting using MACC1- and V5-specific antibodies (vs U138/vector cells, respectively). (B) Anchorage-independent cell proliferation was analyzed by soft agar colony formation assay. MACC1-expressing cells showed a significant increase of formed colonies to 138% (vs U138/vector; P = .026). (C and D) Cell proliferation as determined by the xCELLigence system. Cell index values were monitored every 30 min for the first 12 h, and then every 15 min for the next 88 h (total time course of 100 h). (C) Real-time proliferation curve of U138/vector and U138/MACC1 cells. (D) MACC1-expressing cells show a statistically significant increased proliferation rate (P < .001). (E and F) Cell migration as determined by the xCELLigence system. Cell index values were monitored every 5 min for the first 25 h, and then every 15 min for the next 15 h (total time course of 40 h). (E) Real-time migration curve of U138/vector and U138/MACC1 cells. (F) MACC1-expressing cells show a statistically significant increased migration rate (P = .01).
Fig. 2.
Fig. 2.
Real-time measurements of cell migration and proliferation in the MACC1-overexpressing GBM cell line U251. (A) The human GBM cell line U251 was stably transfected with pcDNA3.1/MACC1. Overexpression of MACC1 was determined by quantitative real-time RT-PCR as well as by Western blotting using MACC1- and V5-specific antibodies (vs U251/vector cells, respectively). (B) Anchorage-independent cell proliferation was analyzed by soft agar colony formation assay. MACC1-expressing cells showed a significant increase of formed colonies to 127% (vs U251/vector; P = .029). (C and D) Cell proliferation as determined by the xCELLigence system. Cell index values were monitored as described in Fig. 1. (C) Real-time proliferation curve of U251/vector and U251/MACC1 cells. (D) MACC1-expressing cells show a statistically significant increased proliferation rate (P = .046). (E and F) Cell migration as determined by the xCELLigence system. Cell index values were monitored as described in Fig. 1. (E) Real-time migration curve of U251/vector and U251/MACC1 cells. (F) MACC1-expressing cells show a statistically significant increased migration rate (P = .003).
Fig. 3.
Fig. 3.
Real-time measurements of cell migration in the MACC1-overexpressing GBM cell line U138 treated with crizotinib. (A) The human GBM cell line U138 was stably transfected with pcDNA3.1/MACC1. Expression of c-Met (Met/G6PDH) mRNA was determined by quantitative real-time RT-PCR in U138/vector as well as in U138/MACC1 cells. (B) Cell migration. For inhibitor experiments, the c-Met inhibitor crizotinib was added to a final concentration of 300 nM to U138/vector as well as to U138/MACC1 cells and cell migration was determined by the xCELLigence system. The area under the curve (AUC) of the cells incubated with (+) or without (−) 300 nM of the c-Met inhibitor crizotinib is shown.
Fig. 4.
Fig. 4.
Tumor formation and morphological characterization of U138 cells in organotypic hippocampal slice cultures of mice with and without crizotinib. (A) Representative images of OHSC treated with U138/vector (upper panel), U138/MACC1 (middle panel), or U138/MACC1 + crizotinib (lower panel). Colonization of the OHSC by U138/MACC1 (middle panel) advanced in a shorter time period and by a higher number of tumor cells compared with U138/vector (upper panel) or cells treated with the c-Met inhibitor (lower panel). The cytoarchitecture was visualized by propidium iodide (red) and tumor cells were labeled by CFDA (green). (B) Quantification of the average tumor numbers per slide and 100 000 cells. (C) Quantification of averaged tumor volume in cubic micrometers with a minimal tumor diameter of 25 µm after 3 and 4 days. On day 3 a significant difference (P = .0075) was found between U138/MACC1 tumors and the vector control, which was reduced to basal levels by crizotinib. (D) Analysis of averaged eccentricities of U138/MACC1 and U138/vector tumors after 3 and 4 days in OHSC. After 3 days a significant difference between both cell types was observed (P = .011), which was prevented by the inhibitor. (E) Analysis of the mean radius of U138/MACC1 and U138/vector tumors after 3 and 4 days in OHSC. At day 3 a significant increase was observed for U138/MACC1 tumors vs vector controls (P = .0005), which was reverted by crizotinib. (B-E) Error bars: ± SEM; Abbreviation: n.d., not determined.
Fig. 5.
Fig. 5.
Expression analysis of MACC1 and c-Met mRNA in human astrocytic tumor samples by semiquantitative RT-PCR and quantitative real-time RT-PCR. (A) Total RNA from NB, LGA WHO grade II, and GBM tissue samples was used as a template for semiquantitative MACC1 RT-PCR analysis. For negative control, cDNA was excluded from the PCR reaction (−). The various cDNA concentrations were normalized to that of the housekeeping gene GAPDH, which was used as internal loading control. The size (bp) of the PCR products is indicated on the right. The numbers refer to the tumor samples used (Table 1). (B) Box plot analysis of densitometrically quantified MACC1 mRNA expression. ANOVA revealed a statistically significant increase of MACC1 mRNA expression (P = .0199). (C) Quantitative real-time MACC1 RT-PCR of human NB (n = 1), LGA (n = 12; median: 0.658), and GBM (n = 17; median: 1.486) tumor samples. The increase in MACC1 mRNA expression of GBM was statistically significant (P = .0048). (D) Quantitative real-time c-Met RT-PCR of human NB (n = 1), LGA (n = 12; median: 0.122), and GBM (n = 17; median: 0.755) tumor samples. The increase in c-Met mRNA expression in GBM was statistically significant (P = .039).
Fig. 6.
Fig. 6.
MACC1 expression on paraffin-embedded sections of representative tissue samples. MACC1 expression (brown signal) was visualized by staining with a specific antibody (right panel). Tissue stained with appropriate isotype control antibodies served as negative control (left panel). Magnification 40×. The scale bar indicates 50 µm. Shown are representative samples of a multiple system atrophy (NB; n = 1), of a dormant LGA WHO grade II (n = 7), of a recurrent LGA WHO grade II (n = 12), of primary GBM (n = 10), and of secondary GBM (n = 4). Insets show single cells at magnification 60× for analysis of intracellular MACC1 localization. Cytoplasmic staining in LGA and primary GBM and additional nuclear staining in secondary GBM are visible.
Fig. 7.
Fig. 7.
Quantification of MACC1-positive tumor cells in relation to all tumor cells. MACC1 protein was stained with a specific antibody on paraffin-embedded tumor sections as representatively shown in Fig. 6. MACC1-positive tumor cells were counted in 5 fields of view at 60× magnification on each section and related to the total number of tumor cells visible. (A) Percentage of MACC1-positive tumor cells in all analyzed LGA (n = 24) in relation to all analyzed GBM (n = 14). Details about tumor samples are given in Table 2. The increased expression of MACC1 in GBM was statistically significant (2-tailed t test, P = .0009). (B) MACC1 expression in dormant LGA (n = 7) was lower compared to recurrent LGA (n = 12; 2-tailed t test, P = .0447). (C) Recurrent LGA (n = 5) did not show a significant difference in MACC1-positive cell number compared with their matched relapse of the same WHO grade (n = 6, paired 2-tailed t test, P = .3900). (D) LGA (n = 6) progressing to secondary GBM (n = 4) showed significantly lower numbers of MACC1-positive cells (paired 2-tailed t test, P = .0348). (E) The percentage of MACC1-positive cells was not significantly different between LGA with a future relapse (n = 5) and LGA progressing to secondary GBM (n = 6, 2-tailed t test, P = .5410). (F) Primary GBM (n = 10) expressed significantly lower amounts of MACC1 than secondary GBM (n = 4; 2-tailed t test, P = .0005). (G) Kaplan–Meier analysis of patients' survival with GBM. MACC1 expression in ≤33% of tumor cells (median expression) was defined as weak expression (n = 8), >33% positive tumor cells was defined as strong expression (n = 6). The difference in the survival curves was statistically significant (P = .0358).

Similar articles

Cited by

References

    1. Talmadge JE, Fidler IJ. AACR centennial series: the biology of cancer metastasis: historical perspective. Cancer Res. 2010;70:5649–5669. - PMC - PubMed
    1. Hannahan D, Weinberg RA. Hallmarks of cancer: the next generation. Cell. 2011;144:646–674. - PubMed
    1. Stein U, Walther W, Arlt F, et al. MACC1, a newly identified key regulator of HGF-MET signaling, predicts colon cancer metastasis. Nat Med. 2009;15:59–67. - PubMed
    1. Arlt F, Stein U. Colon cancer metastasis: MACC1 and Met as metastatic pacemakers. Int J Biochem Cell Biol. 2009;41:2356–2359. - PubMed
    1. Pichorner A, Sack U, Kobelt D, et al. In vivo imaging of colorectal cancer growth and metastasis by targeting MACC1 with shRNA in xenografted mice. Clin Exp Metastasis. 2012;29:573–583. - PubMed

MeSH terms