. 2014 Jan;10(1):123-36.
doi: 10.4161/auto.26841. Epub 2013 Nov 8.

Role of autophagy, SQSTM1, SH3GLB1, and TRIM63 in the turnover of nicotinic acetylcholine receptors

Affiliations

Role of autophagy, SQSTM1, SH3GLB1, and TRIM63 in the turnover of nicotinic acetylcholine receptors

Muzamil Majid Khan et al. Autophagy. 2014 Jan.

Abstract

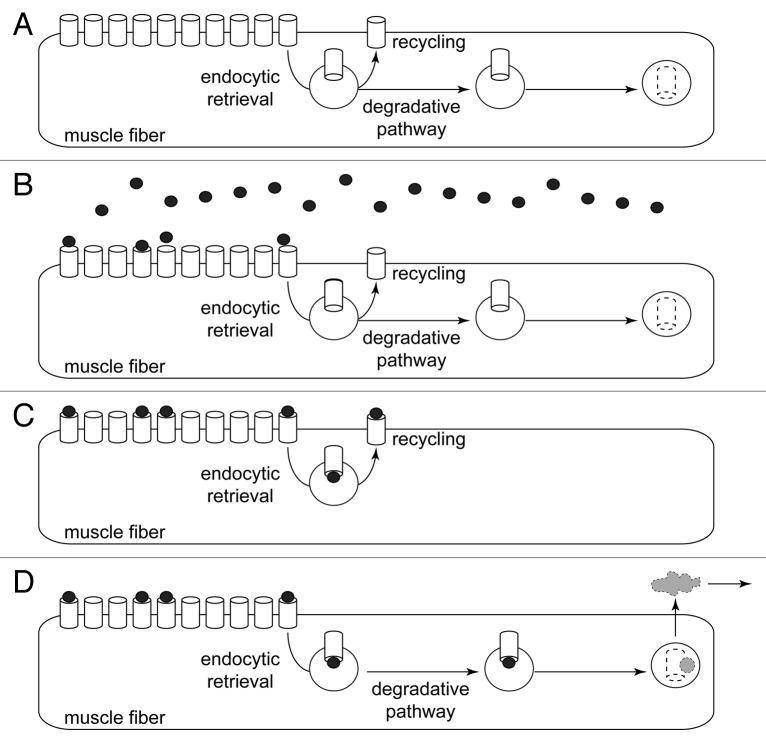
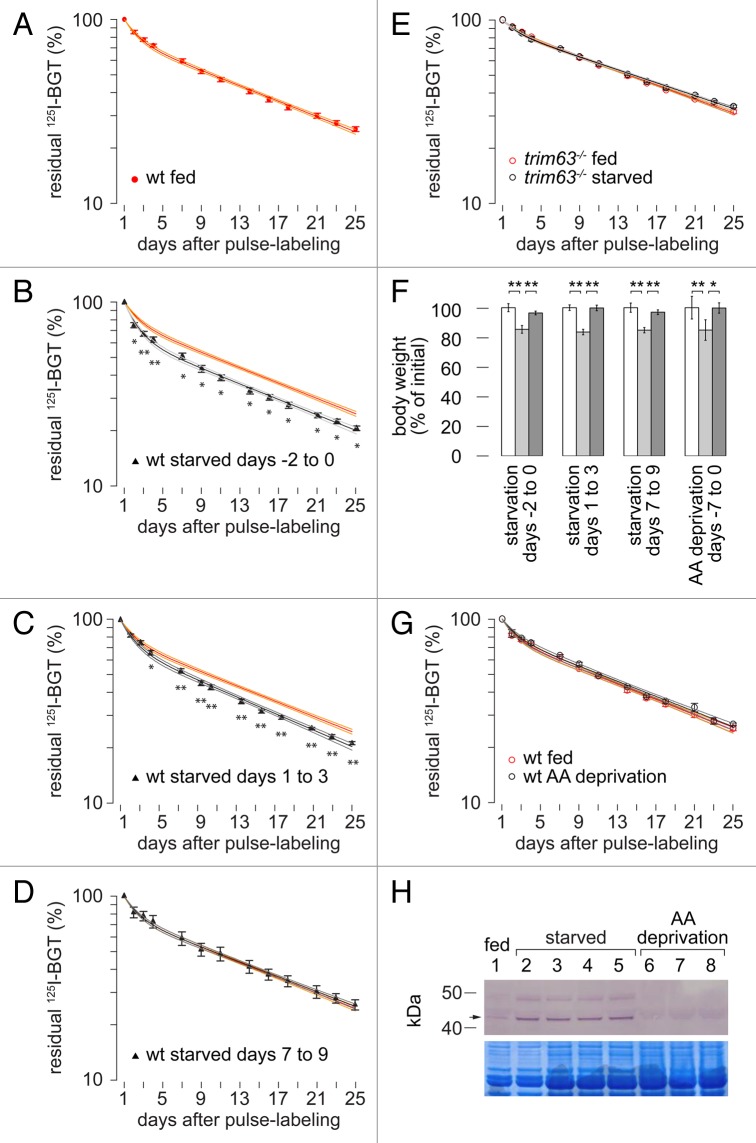
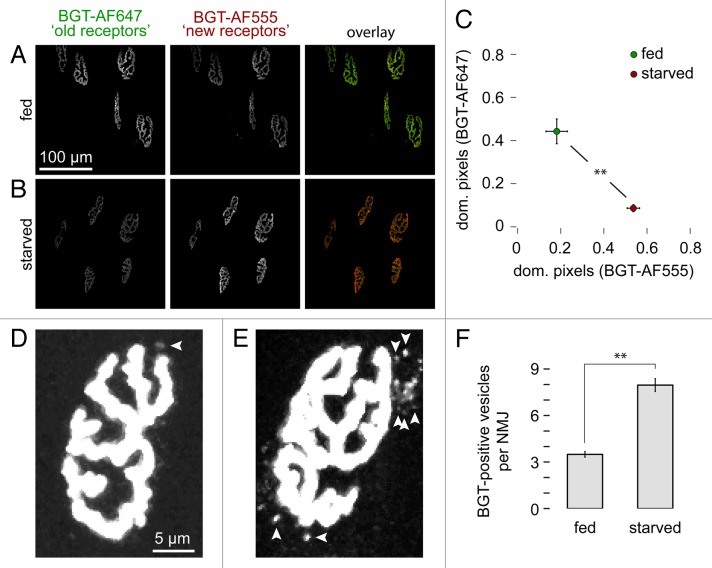
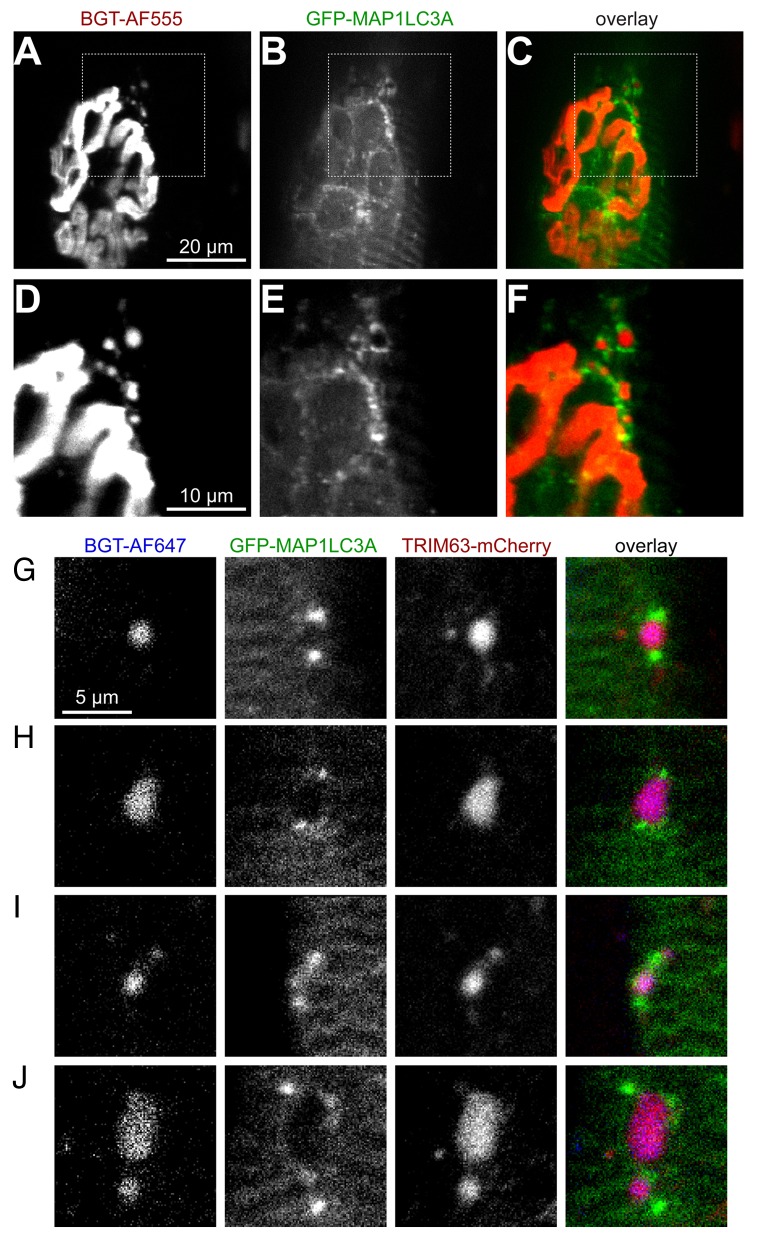
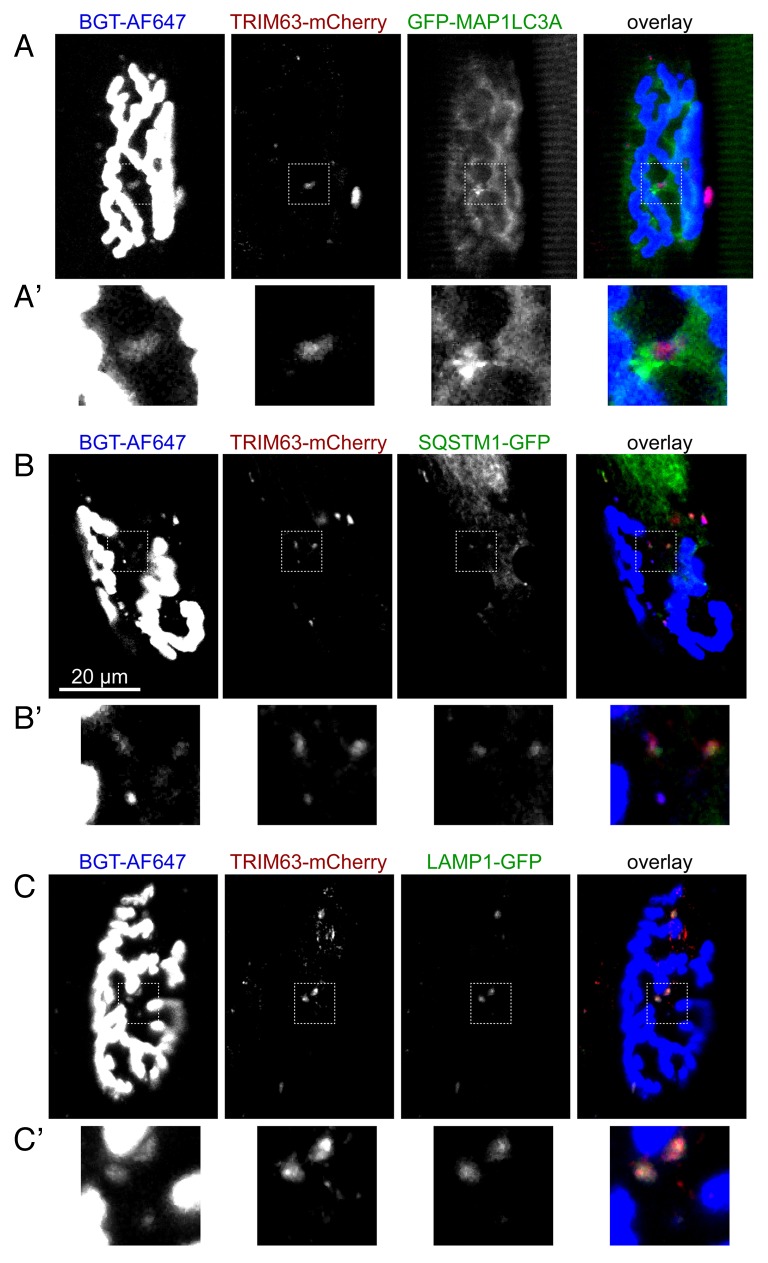
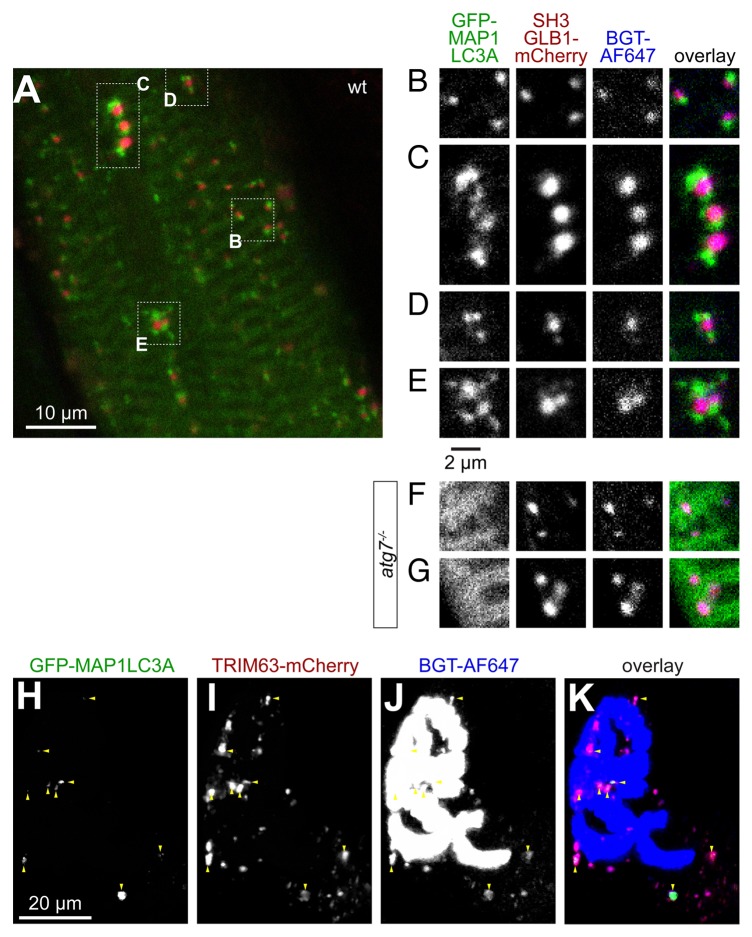
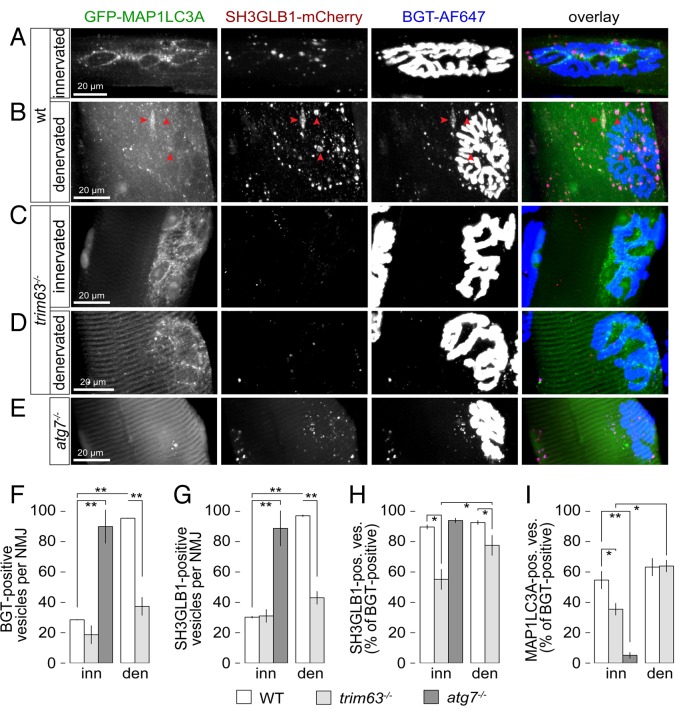
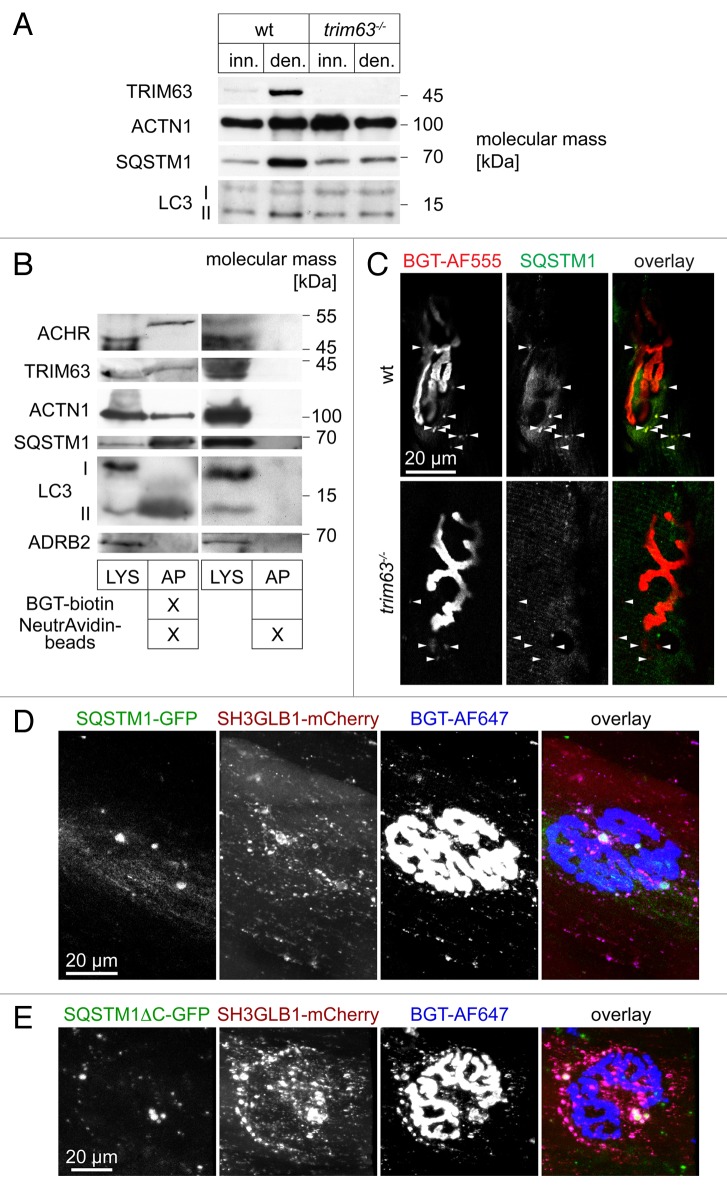
Removal of ubiquitinated targets by autophagosomes can be mediated by receptor molecules, like SQSTM1, in a mechanism referred to as selective autophagy. While cytoplasmic protein aggregates, mitochondria, and bacteria are the best-known targets of selective autophagy, their role in the turnover of membrane receptors is scarce. We here showed that fasting-induced wasting of skeletal muscle involves remodeling of the neuromuscular junction (NMJ) by increasing the turnover of muscle-type CHRN (cholinergic receptor, nicotinic/nicotinic acetylcholine receptor) in a TRIM63-dependent manner. Notably, this process implied enhanced production of endo/lysosomal carriers of CHRN, which also contained the membrane remodeler SH3GLB1, the E3 ubiquitin ligase, TRIM63, and the selective autophagy receptor SQSTM1. Furthermore, these vesicles were surrounded by the autophagic marker MAP1LC3A in an ATG7-dependent fashion, and some of them were also positive for the lysosomal marker, LAMP1. While the amount of vesicles containing endocytosed CHRN strongly augmented in the absence of ATG7 as well as upon denervation as a model for long-term atrophy, denervation-induced increase in autophagic CHRN vesicles was completely blunted in the absence of TRIM63. On a similar note, in trim63(-/-) mice denervation-induced upregulation of SQSTM1 and LC3-II was abolished and endogenous SQSTM1 did not colocalize with CHRN vesicles as it did in the wild type. SQSTM1 and LC3-II coprecipitated with surface-labeled/endocytosed CHRN and SQSTM1 overexpression significantly induced CHRN vesicle formation. Taken together, our data suggested that selective autophagy regulates the basal and atrophy-induced turnover of the pentameric transmembrane protein, CHRN, and that TRIM63, together with SH3GLB1 and SQSTM1 regulate this process.

Keywords: Bif-1; LC3; MuRF1; SQSTM1/p62; acetylcholine receptor; atrophy; endophilin B1; neuromuscular junction; selective autophagy.


Figures

None
Figure 1. Radioiodine labeling detects total amount of 125I contained in muscle. Scheme illustrating the working principle of the radioiodine approach. (A) Pre-pulse situation. CHRN channels (white barrels) are present at high amounts in the postsynaptic membranes of muscle fibers. Small amounts of CHRN are constantly internalized by endocytic retrieval. From there, CHRN might undergo recycling back to the plasma membrane or follow a degradative pathway. (B) Pulse labeling with 125I-BGT (black dots). About 10% of the 125I-BGT binds to CHRN in the injected hind limb, the rest of the 25I-BGT is washed out and binds to other muscles or is excreted. (C and D) CHRN labeled with 125I-BGT undergo either recycling (C) or are degraded (D). Only in the latter case, 125I is removed from the muscle (gray cloud), i.e., the radioiodine approach measures the rate of 125I removal from the muscle as a consequence of CHRN degradation.
None
Figure 2. Fasting affects CHRN turnover only of newly formed receptors in a TRIM63-dependent manner. (A–E) Tibialis anterior muscles of WT or trim63−/− mice were labeled with 125I-BGT (“pulse-labeling”) on day 0 and 125I-emission from hindlegs was then repetitively monitored at indicated time points. Animals were either fed ad libitum (A) or starved for 48 h 2 d before (B and E), 1 d (C) or 7 d after pulse-labeling (D). Graphs depict residual 125I-emission normalized to the values measured on day 1. Symbols and red or black lines represent measured values (mean ± SEM, n = 32, n = 15, n = 14, and n = 4 muscles in A–D, respectively) and 2-term exponential fits, respectively. Orange and gray lines show 95% confidence intervals. The ” WT fed” graph is repeated in (A–D) for better comparison. Significance was tested between measurement values at each time point: *P < 0.05; **P < 0.01 according to the Welch test. Note significant CHRN destabilization in (B and C), but not in (D and E). (F–H) WT mice were either fasted for 48 h or fed ad libitum with amino acid-free chow for 7 d. Animals were weighed immediately before and after treatment and one more time 3 to 4 weeks later. After 7 d of amino acid deprivation, tibialis anterior muscles of amino acid-deprived animals were labeled with 125I-BGT (“pulse-labeling”) on day 0 and 125I-emission from hindlegs was then repetitively monitored at the indicated time points. (F) Body weights of animals before (white columns), after (light gray columns), and 3 to 4 weeks after fasting (dark gray columns). Mean ± SEM (n ≥ 3 mice for each condition). *P < 0.05; **P < 0.01 according to the Welch test. (G) Graphs depict residual 125I-emission normalized to the values measured on day 1. Symbols and black/red lines show measured values (mean ± SEM, n = 3 mice for each condition) and 2-term exponential fits, respectively. Orange and gray lines show 95% confidence intervals. Significance was tested between measurement values at each time point. (H) Images depict western blot signals (upper) and Coomassie-stained corresponding SDS-PAGE (lower). Lanes, loading of muscle lysates from animals that were either control fed (lane 1), starved for 48 h (lanes 2 to 5), or amino acid-deprived for five days (lanes 6 to 8). Arrow indicates height of TRIM63.
None
Figure 3. Starvation leads to increased CHRN turnover and enhances the amount of endo/lysosomal carriers containing CHRN at the NMJ. CHRNs in tibialis anterior muscles were labeled with BGT-AF647 (“old receptors”) after 48 h of starvation and 10 d later muscles were reinjected with BGT-AF555 (“new receptors”). Then, in vivo microscopy was performed and an automated algorithm determined the relative amount of pixels dominant for either “new receptor” or “old receptor” signals. The number of endo/lysosomal carriers containing CHRN was counted manually after electronically enhancing the signal using ImageJ. (A and B) Maximum z-projections of confocal stacks showing automatically segmented NMJs from fed (A) and starved (B) mice. In the overlay panels (right) old receptor and new receptor signals are shown in green and red, respectively. (C) Quantitative analysis. Graph depicts mean ± SEM of the relative amounts of pixels dominant for either new receptor or old receptor signals in each NMJ (n = 12 [293 NMJs] and n = 4 [106 NMJs] muscles for fed and starved conditions, respectively). **P < 0.01 according to the Welch test. (D and E) Maximum z-projections of NMJs from fed (D) and fasted muscles (E). Arrowheads indicate BGT-AF positive endo/lysosomal carriers. (F) Quantitative analysis. Graph depicts the average amount of BGT-positive vesicles per NMJ. Mean ± SEM (n = 6 and n = 3 muscles for fed and fasted conditions, respectively. 50 NMJs analyzed for each condition). **P < 0.01 according to the Welch test.
None
Figure 4. Endo/lysosomal carriers containing CHRN colocalize with TRIM63 and are capped by MAP1LC3A. Mouse tibialis anterior muscles were either transfected with GFP-MAP1LC3A (A–F) or cotransfected with GFP-MAP1LC3A and TRIM63-mCherry (G–J). After 7 d, CHRNs were marked with BGT-AF555 (A–F) or with BGT-AF647 (G–J) and 24 h later, in vivo imaging was performed. (A–C) Single optical slice of a GFP-MAP1LC3A-positive fiber showing the NMJ as pretzel-shaped structure in (A) and endocytic CHRN-containing puncta at the upper right corner of the NMJ. GFP-MAP1LC3A signals in (B), (C) overlay of CHRN (red) and MAP1LC3A (green). (D–F) Blow-up of the upper right corner of NMJ as depicted in (A–C). (G–J) Confocal slices showing exemplary colocalization patterns for CHRN, GFP-MAP1LC3A, and TRIM63-mCherry. Mostly, MAP1LC3A capped CHRN- and TRIM63-double-positive puncta at two ends, but also more complex patterns were observed (J). Similar marker distributions were observed upon at least 2 different transfections.
None
Figure 5. Endo/lysosomal carriers containing CHRN colocalize with a panel of autophagic and lysosomal markers. Mouse tibialis anterior muscles were cotransfected with TRIM63-mCherry and either GFP-MAP1LC3A (A), SQSTM1-GFP (B), or LAMP1-GFP (C). After 7 d, CHRNs were marked with BGT-AF647 and 24 h later, muscles were imaged using in vivo confocal microscopy. All panels show single optical slices with CHRN signals (left column), TRIM63-mCherry signals (middle column) and GFP-constructs (right column) followed by an overlay. Similar marker distributions were observed upon at least 2 different transfections.
None
Figure 6. SH3GLB1 perfectly matches endocytic CHRN carriers and is capped by MAP1LC3A in an ATG7-dependent manner. Tibialis anterior muscles of WT (A–E and H–K) or atg7−/− mice (F and G) were cotransfected with either SH3GLB1-mCherry and GFP-MAP1LC3A (A–G) or with SH3GLB1-mCherry and TRIM63-GFP (H–K). After 7 d, CHRNs were marked with BGT-AF647 and 24 h later, muscles were imaged using in vivo confocal microscopy. (A) Overview single optical slice showing the general codistribution of MAP1LC3A (green) and SH3GLB1 (red) in WT muscle. (B–E) Details from (A) showing exemplary colocalization patterns. While SH3GLB1 and CHRN colocalize perfectly and almost quantitatively, MAP1LC3A accompanies SH3GLB1- and CHRN-positive puncta either on 1 side (B), on 2 ends (C), or with more complex arrangements (D and E). (F and G) In atg7−/− muscle MAP1LC3A is mostly distributed on sarcomeric striations and does not accompany SH3GLB1 and CHRN double-positive vesicles. (H–K) Maximum z-projection of a double-transfected fiber at the level of the NMJ. Fluorescence signals as indicated on top right angle of panels. In the overlay (I), TRIM63 signals are shown in green, SH3GLB1 in red, CHRN in blue. Triple-positive signals are indicated with red arrowheads.
None
Figure 7. Endocytic CHRN carriers proliferate upon denervation in a TRIM63-dependent manner. Mouse tibialis anterior muscles of WT, trim63−/−, or atg7−/− mice were cotransfected with SH3GLB1-mCherry and GFP-MAP1LC3A. Five days before imaging, WT and trim63−/− muscles were unilaterally denervated. Twenty-four hours before in vivo confocal microscopy imaging CHRNs were stained with BGT-AF647. (A–E) Maximum z-projections of individual SH3GLB1 and MAP1LC3A double-positive fibers at the level of their NMJs from innervated (A, C, and E) or denervated muscles (B and D) of either WT (A and B), trim63−/− (C and D), or atg7−/− mice. Red arrowheads in (B) depict sac-like triple-positive structures, which resemble multivesicular bodies or amphisomes. (F–I) Quantitative analyses as indicated. All graphs depict mean ± SEM (WT and trim63−/−: n = 3 muscles, between 616 and 1415 structures were analyzed per condition. atg7−/−: n = 4 muscles, 2800 structures were analyzed). *P < 0.05; **P < 0.01 according to the Welch test.
None
Figure 8. SQSTM1 is upregulated in a TRIM63-dependent manner, it colocalizes with endocytic CHRN and regulates CHRN carrier formation. (A) Representative western blot signals against TRIM63, ACTN1 (loading control), SQSTM1 and MAP1LC3A from lysates of WT or trim63−/− gastrocnemius muscles, that were either innervated (inn.) or denervated for 5 d (den.). (B) WT mouse gastrocnemius muscles were injected with BGT-biotin (left 2 lanes) or with saline (right 2 lanes). Five hours later, mice were sacrificed, and muscles harvested and lysed. Subsequently, BGT-biotin labeled CHRN were sedimented with NeutrAvidin-coupled beads. Depicted are representative western blot immunosignals using antibodies against CHRN, SQSTM1, MAP1LC3A, TRIM63, ACTN1 (positive control), and ADRB2 (negative control). LYS, lysate; AP, biotin-neutravidin affinity precipitate. (C) Denervated EDL muscles from WT and trim63−/− mice were sectioned and stained with BGT-AF555 against CHRN and with an antibody against SQSTM1. Shown are single confocal sections depicting parts of individual NMJs surrounded by some punctate CHRN-positive structures (arrowheads). While in the WT most of these puncta also exhibit SQSTM1 immunofluorescence signals, this is not the case in muscle lacking TRIM63. In the overlay pictures, BGT and anti-SQSTM1 signals appear in red and green, respectively. (D and E) WT tibialis anterior muscles were cotransfected with SH3GLB-mCherry and either SQSTM1-GFP (C) or SQSTM1ΔC-GFP (D). After 7 d, BGT-AF647 was injected and 24 h later, muscles were imaged in vivo. Shown are en face maximum z-projections. In the overlay pictures, GFP-, mCherry- and BGT-signals appear in green, red, and blue, respectively.

Similar articles

Cited by

  • The TOR Pathway at the Neuromuscular Junction: More Than a Metabolic Player?
    Castets P, Ham DJ, Rüegg MA. Castets P, et al. Front Mol Neurosci. 2020 Aug 28;13:162. doi: 10.3389/fnmol.2020.00162. eCollection 2020. Front Mol Neurosci. 2020. PMID: 32982690 Free PMC article. Review.
  • Do neurogenic and cancer-induced muscle atrophy follow common or divergent paths?
    Bouchè M, Lozanoska-Ochser B, Proietti D, Madaro L. Bouchè M, et al. Eur J Transl Myol. 2018 Dec 13;28(4):7931. doi: 10.4081/ejtm.2018.7931. eCollection 2018 Nov 2. Eur J Transl Myol. 2018. PMID: 30662704 Free PMC article.
  • Variations of chromosomes 2 and 3 gene expression profiles among pulmonary telocytes, pneumocytes, airway cells, mesenchymal stem cells and lymphocytes.
    Zheng M, Sun X, Zhang M, Qian M, Zheng Y, Li M, Cretoiu SM, Chen C, Chen L, Cretoiu D, Popescu LM, Fang H, Wang X. Zheng M, et al. J Cell Mol Med. 2014 Oct;18(10):2044-60. doi: 10.1111/jcmm.12429. Epub 2014 Oct 2. J Cell Mol Med. 2014. PMID: 25278030 Free PMC article.
  • Neuromuscular junction degeneration in muscle wasting.
    Rudolf R, Deschenes MR, Sandri M. Rudolf R, et al. Curr Opin Clin Nutr Metab Care. 2016 May;19(3):177-81. doi: 10.1097/MCO.0000000000000267. Curr Opin Clin Nutr Metab Care. 2016. PMID: 26870889 Free PMC article. Review.
  • Guidelines for the use and interpretation of assays for monitoring autophagy (4th edition)1.
    Klionsky DJ, Abdel-Aziz AK, Abdelfatah S, Abdellatif M, Abdoli A, Abel S, Abeliovich H, Abildgaard MH, Abudu YP, Acevedo-Arozena A, Adamopoulos IE, Adeli K, Adolph TE, Adornetto A, Aflaki E, Agam G, Agarwal A, Aggarwal BB, Agnello M, Agostinis P, Agrewala JN, Agrotis A, Aguilar PV, Ahmad ST, Ahmed ZM, Ahumada-Castro U, Aits S, Aizawa S, Akkoc Y, Akoumianaki T, Akpinar HA, Al-Abd AM, Al-Akra L, Al-Gharaibeh A, Alaoui-Jamali MA, Alberti S, Alcocer-Gómez E, Alessandri C, Ali M, Alim Al-Bari MA, Aliwaini S, Alizadeh J, Almacellas E, Almasan A, Alonso A, Alonso GD, Altan-Bonnet N, Altieri DC, Álvarez ÉMC, Alves S, Alves da Costa C, Alzaharna MM, Amadio M, Amantini C, Amaral C, Ambrosio S, Amer AO, Ammanathan V, An Z, Andersen SU, Andrabi SA, Andrade-Silva M, Andres AM, Angelini S, Ann D, Anozie UC, Ansari MY, Antas P, Antebi A, Antón Z, Anwar T, Apetoh L, Apostolova N, Araki T, Araki Y, Arasaki K, Araújo WL, Araya J, Arden C, Arévalo MA, Arguelles S, Arias E, Arikkath J, Arimoto H, Ariosa AR, Armstrong-James D, Arnauné-Pelloquin L, Aroca A, Arroyo DS, Arsov I, Artero R, Asaro DML, Aschner M, Ashrafizadeh M, Ashur-Fabian O, Atanasov AG, Au AK, Auberger P, Auner HW, Aurelian L, Autelli R… See abstract for full author list ➔ Klionsky DJ, et al. Autophagy. 2021 Jan;17(1):1-382. doi: 10.1080/15548627.2020.1797280. Epub 2021 Feb 8. Autophagy. 2021. PMID: 33634751 Free PMC article.

References

    1. Shaid S, Brandts CH, Serve H, Dikic I. . Ubiquitination and selective autophagy. Cell Death Differ 2013; 20:21 - 30; http://dx.doi.org/10.1038/cdd.2012.72; PMID: 22722335 - DOI - PMC - PubMed
    1. Bjørkøy G, Lamark T, Brech A, Outzen H, Perander M, Overvatn A, Stenmark H, Johansen T. . p62/SQSTM1 forms protein aggregates degraded by autophagy and has a protective effect on huntingtin-induced cell death. J Cell Biol 2005; 171:603 - 14; http://dx.doi.org/10.1083/jcb.200507002; PMID: 16286508 - DOI - PMC - PubMed
    1. Kirkin V, Lamark T, Sou YS, Bjørkøy G, Nunn JL, Bruun JA, Shvets E, McEwan DG, Clausen TH, Wild P, et al. . . A role for NBR1 in autophagosomal degradation of ubiquitinated substrates. Mol Cell 2009; 33:505 - 16; http://dx.doi.org/10.1016/j.molcel.2009.01.020; PMID: 19250911 - DOI - PubMed
    1. Pankiv S, Clausen TH, Lamark T, Brech A, Bruun JA, Outzen H, Øvervatn A, Bjørkøy G, Johansen T. . p62/SQSTM1 binds directly to Atg8/LC3 to facilitate degradation of ubiquitinated protein aggregates by autophagy. J Biol Chem 2007; 282:24131 - 45; http://dx.doi.org/10.1074/jbc.M702824200; PMID: 17580304 - DOI - PubMed
    1. Tanji K, Mori F, Kakita A, Takahashi H, Wakabayashi K. . Alteration of autophagosomal proteins (LC3, GABARAP and GATE-16) in Lewy body disease. Neurobiol Dis 2011; 43:690 - 7; http://dx.doi.org/10.1016/j.nbd.2011.05.022; PMID: 21684337 - DOI - PubMed

Publication types

MeSH terms