. 2013:4:2730.
doi: 10.1038/ncomms3730.

Identification of a pan-cancer oncogenic microRNA superfamily anchored by a central core seed motif

Affiliations
Free PMC article

Identification of a pan-cancer oncogenic microRNA superfamily anchored by a central core seed motif

Mark P Hamilton et al. Nat Commun. 2013.
Free PMC article

Abstract

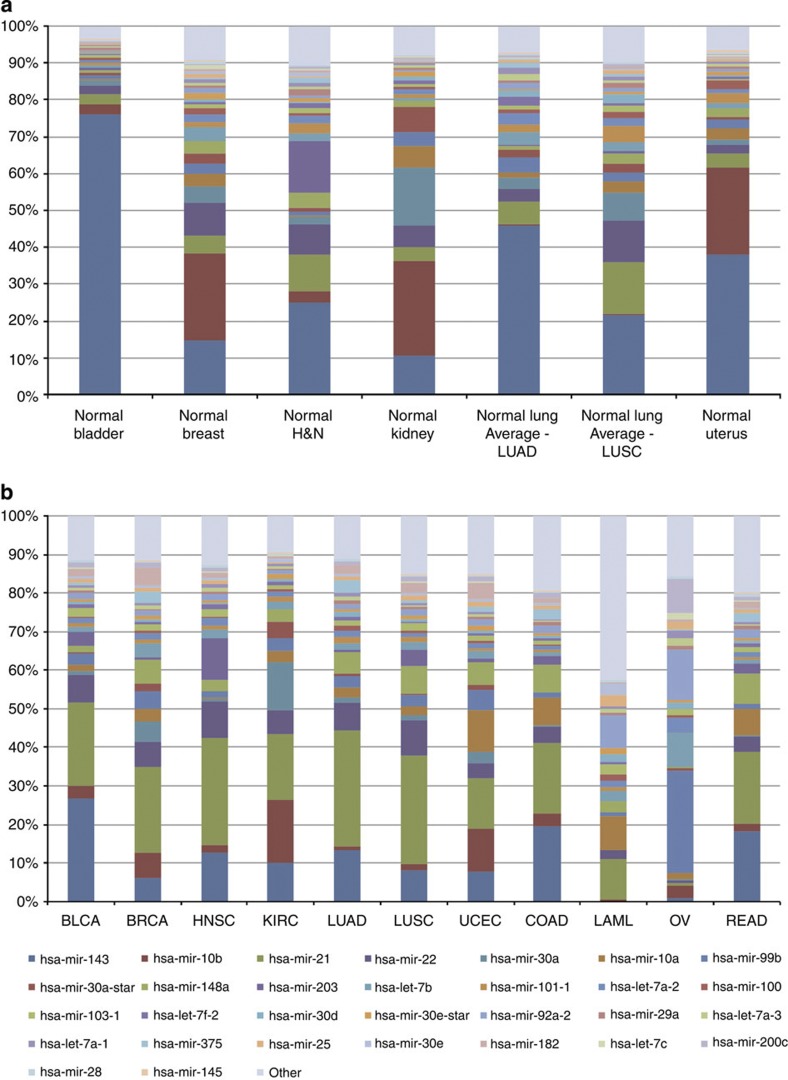
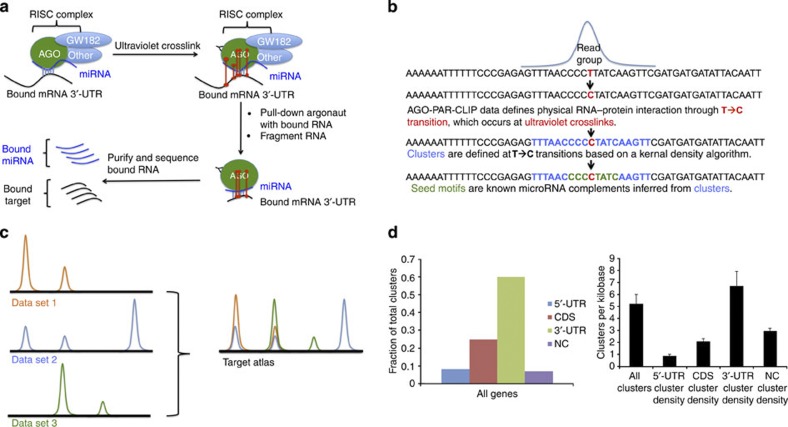
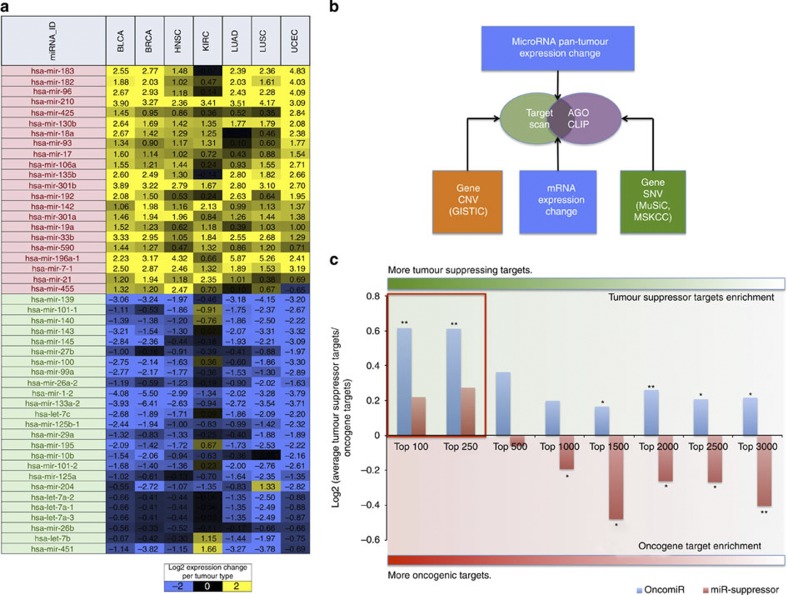
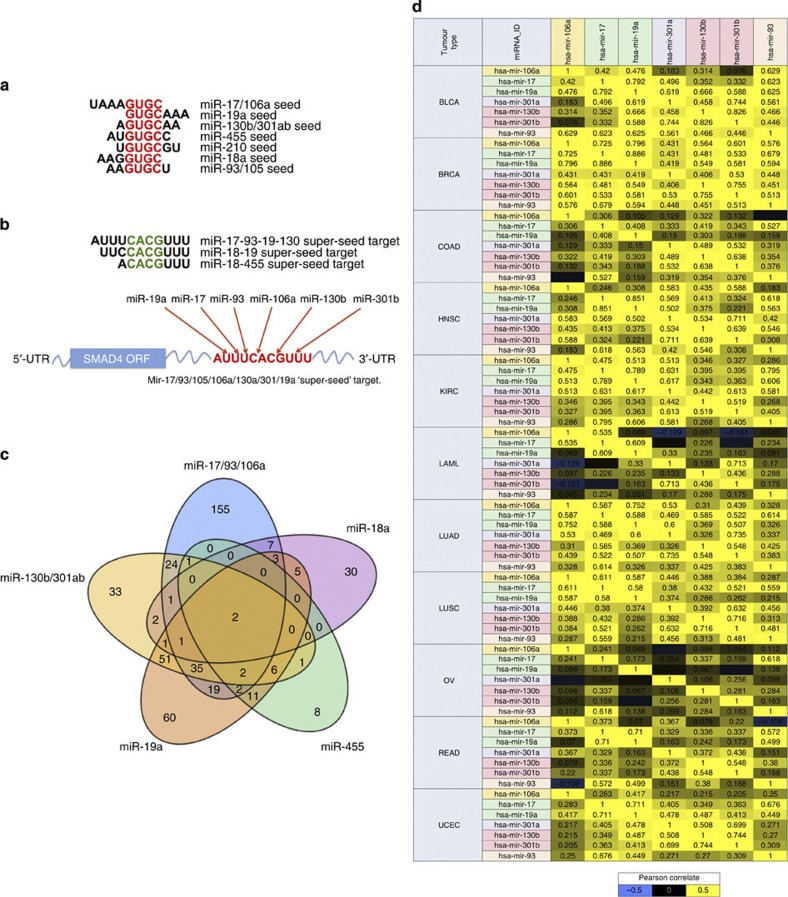
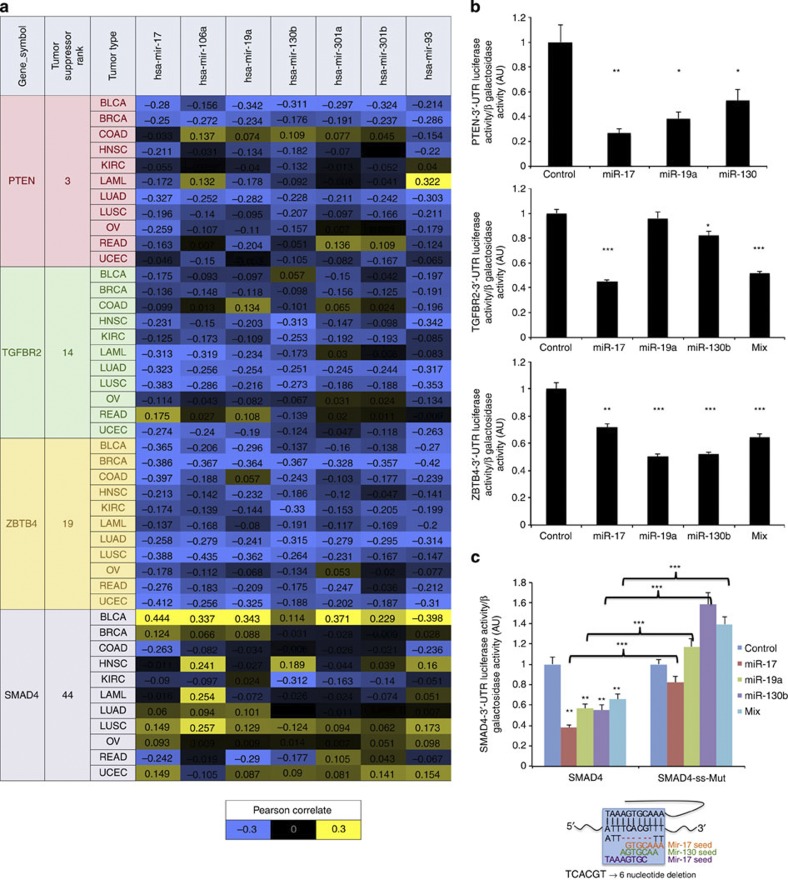
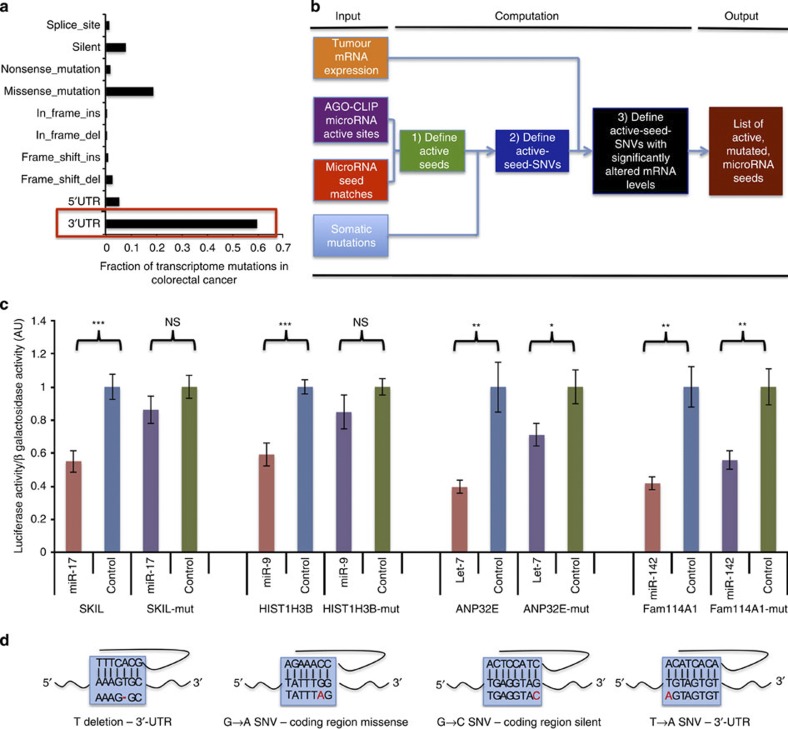
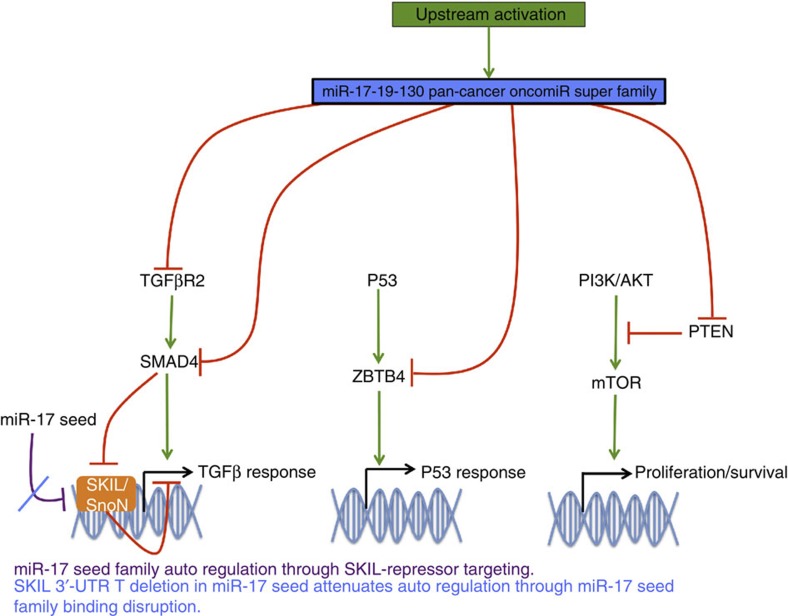
MicroRNAs modulate tumorigenesis through suppression of specific genes. As many tumour types rely on overlapping oncogenic pathways, a core set of microRNAs may exist, which consistently drives or suppresses tumorigenesis in many cancer types. Here we integrate The Cancer Genome Atlas (TCGA) pan-cancer data set with a microRNA target atlas composed of publicly available Argonaute Crosslinking Immunoprecipitation (AGO-CLIP) data to identify pan-tumour microRNA drivers of cancer. Through this analysis, we show a pan-cancer, coregulated oncogenic microRNA 'superfamily' consisting of the miR-17, miR-19, miR-130, miR-93, miR-18, miR-455 and miR-210 seed families, which cotargets critical tumour suppressors via a central GUGC core motif. We subsequently define mutations in microRNA target sites using the AGO-CLIP microRNA target atlas and TCGA exome-sequencing data. These combined analyses identify pan-cancer oncogenic cotargeting of the phosphoinositide 3-kinase, TGFβ and p53 pathways by the miR-17-19-130 superfamily members.


Figures

Figure 1
Figure 1. The landscape of microRNA expression in the TCGA pan-cancer data set.
(a) Thirty microRNAs constitute 90% of microRNA expression across all normal tissues. (b) Global microRNA expression change occurring in tumours is due principally to loss of miR-143 expression and gain of miR-21 expression. MicroRNAs represented in columns from bottom to top listed left to right by row legend.
Figure 2
Figure 2. Generation of the AGO-CLIP microRNA target atlas.
(a) Model of AGO-CLIP-mediated purification of bound microRNAs and target. (b) Example of PAR-CLIP-defined microRNA binding sites. De novo seed identification in this data set requires PAR-CLIP reads. Supplementary identification of recurrent binding sites is allowed for HITS-CLIP data. (c) Construction of seed atlas from multiple data sets emphasizes seeds recurrent across multiple data sets to define high-confidence microRNA active sites. (d) MicroRNA clusters are most frequently mapped to the 3′-UTR region, consistent with previous observations. 3′-UTR, 3′-untranslated region; 5′-UTR, 5′-untranslated region; CDS, coding sequence; NC, non-coding RNA. Error bars represent s.e.m, data is taken from a compilation of 11 AGO-PAR-CLIP libraries used in this study and defined using the 12,449 UCSC known genes with at least one AGO-CLIP cluster mapping to them.
Figure 3
Figure 3. Determination of pan-cancer microRNAs and their targets.
(a) List of broadly conserved pan-cancer oncomiRs and miR suppressors reveals microRNAs undergoing consistent expression changes across the pan-cancer data set. (b) A dual nomination strategy uses AGO-CLIP microRNA target definitions to associate pan-cancer microRNAs to respective TS and OC targets to define relevant pan-tumour microRNA–target relationships. (c) TS target versus oncomiR target enrichments for pan-cancer oncomiRs (blue bars) and miR suppressors (red bars) across the top 100–3,000 (∼10% of genes) TS and OCs. This graph represents the enrichments and significance levels of those enrichments of both pan-cancer oncomiRs and miR suppressors. Individual bars in the graph represent the log2-based per cent TS over per cent OC targets. Positive bars demonstrate average total enrichment for TS. Negative bars demonstrate average enrichment for OCs. An asterisk defines significant enrichments. Red box highlights enrichment of pan-cancer oncomiRs with their top 250 targets used in subsequent analysis. Student’s t-test, *P<0.05, **P<0.005. N-values for enrichment reflect the total number of pan-cancer oncomiRs (n=22) and pan-cancer miR suppressors (n=25).
Figure 4
Figure 4. Pan-cancer oncomiRs are grouped into a coregulated superfamily of pan-oncomiRs.
(a) Broadly conserved pan-cancer oncomiRs (45.4%) share a central GUGC seed sequence homology, grouping them into a larger oncomiR ‘superfamily’ consisting of miR-17, -19, -130, -210, -18 and -455 seeds. (b) MicroRNA superfamilies often target complementary ‘super seeds’. (c) Overview of target predictions for the top 3,000 highest-ranked TS for miR-17, -19, -130, -210 -18 and -455 families demonstrates TS cotargeting relationships with 39.2% of miR-17/106a/93 targets, 70.2% of miR-19 targets, 79.3% of miR-130/301ab targets, 42.3.0% of miR-18a targets, 75.7% miR-455 targets and 62.5% of miR-210 targets having predicted cotargeting with at least one other superfamily member. The miR-93 family has largely the same predicted target spectrum as that of the miR-17 family. miR-210 has few AGO-CLIP-defined targets and was thus not included in the Venn. miR-93 is grouped with the miR-17 family in this analysis, because their target spectrums almost completely overlap. The microRNA-17, -19 and -130 families most heavily mediate pan-cancer cotargeting. (d) miR-17-19-130 superfamily members are strongly correlated across pan-cancer tumours, demonstrating potent coregulation of these microRNAs (P<1E-200, Student’s t-test). MicroRNAs are colour-coded based on co-localization to the same genomic cluster. microRNA–microRNA correlate n-values are as follows: BLCA=95, BRCA=794, COAD=177, HNSC=301, KIRC=466, LAML=173, LUAD=313, LUSC=193, ovarian carcinoma (OV)=225, READ=65 and uterine corpus endometrioid carcinoma (UCEC)=320.
Figure 5
Figure 5. The miR-17-19-130 pan-cancer oncomiR superfamily binds and suppresses potent pan-cancer suppressor genes.
(a) miR-17-19-130 microRNA–mRNA target correlations across tumours reveals strong negative correlation between superfamily members and their top ranked TS targets TGFBR2, PTEN and ZBTB4, but not SMAD4. (b) The miR-17-19-130 superfamily is able to coordinately bind and suppress expression of TS 3′-UTR–luciferase reporter constructs, indicating powerful interaction potential. (c) Superfamily cotargeting on the SMAD4 3′-UTR occurs at a novel microRNA super-seed locus where multiple microRNA seed families can bind, allowing for potential binding of more than individual microRNAs. Mix, an equimolar mixture of miR-17, -19a and -130b to demonstrate the co-repressive capacity of the oncomiR superfamily as it would exist in the cellular context. *P<0.05, **P<0.005, ***P<0.0005, Student’s t-test. Luciferase assays were performed twice at 5 nM mimic and twice at 10 nM in quadruplicate. Results were combined for final analysis (n=16). Error bars are s.e.m. microRNA–mRNA correlate n-values are as follows: BLCA=95, BRCA=794, COAD=177, HNSC=301, KIRC=466, LAML=173, LUAD=313, LUSC=193, ovarian carcinoma (OV)=225, READ=65 and uterine corpus endometrioid carcinoma (UCEC)=320. These numbers reflect the total number of TCGA tumour samples that are characterized with both mRNA and microRNA sequencing.
Figure 6
Figure 6. The miSNP algorithm defines mutations in microRNA seeds.
(a) 3′-UTR mutations make a disproportionate number of all mutations effecting mRNAs. (b) Work flow of miSNP algorithm, which integrates TCGA mutation and mRNA expression analysis and AGO-CLIP seed nominations to determine mutations in active microRNA seeds. (c) Validation of selected AGO-CLIP-defined seed SNVs demonstrates the ability for endogenous tumour mutations to ablate microRNA regulation in a predictable, seed-dependent manner. (d) Mutations reproduced in each 3′UTR construct matching endogenous somatic mutations found in the TCGA pan-cancer data as they relate to the cognate microRNA seed. *P<0.05, **P<0.005, NS, not significant; values measured with Student’s t-test. Assays were performed twice at 5 nM mimic and twice at 10 nM in quadruplicate. Results were combined for final analysis (n=16). Error bars are s.e.m.
Figure 7
Figure 7. A model of Pan-cancer suppressor pathway regulation by miR-17-19-130 superfamily as defined by AGO-CLIP analysis.
The microRNA-17-19-130 superfamily heavily targets critical TS in multiple pathways, including the TGFβ pathway, the phosphoinositide 3-kinase/AKT pathway and the P53 pathway. Additional target site mutation analysis reveals ablation of a miR-17-mediated negative feedback loop through mutation of the miR-17 binding site on the SKIL OC 3′-UTR, demonstrating a novel mechanism of tumour escape from microRNA regulation.

References

    1. Selbach M. et al.. Widespread changes in protein synthesis induced by microRNAs. Nature 455, 58–63 (2008). - PubMed
    1. Mukherji S. et al.. MicroRNAs can generate thresholds in target gene expression. Nat. Genet. 43, 854–859 (2011). - PMC - PubMed
    1. Guo H., Ingolia N. T., Weissman J. S. & Bartel D. P. Mammalian microRNAs predominantly act to decrease target mRNA levels. Nature 466, 835–840 (2010). - PMC - PubMed
    1. Lu J. et al.. MicroRNA expression profiles classify human cancers. Nature 435, 834–838 (2005). - PubMed
    1. Martello G. et al.. A microRNA targeting dicer for metastasis control. Cell 141, 1195–1207 (2010). - PubMed

Publication types